
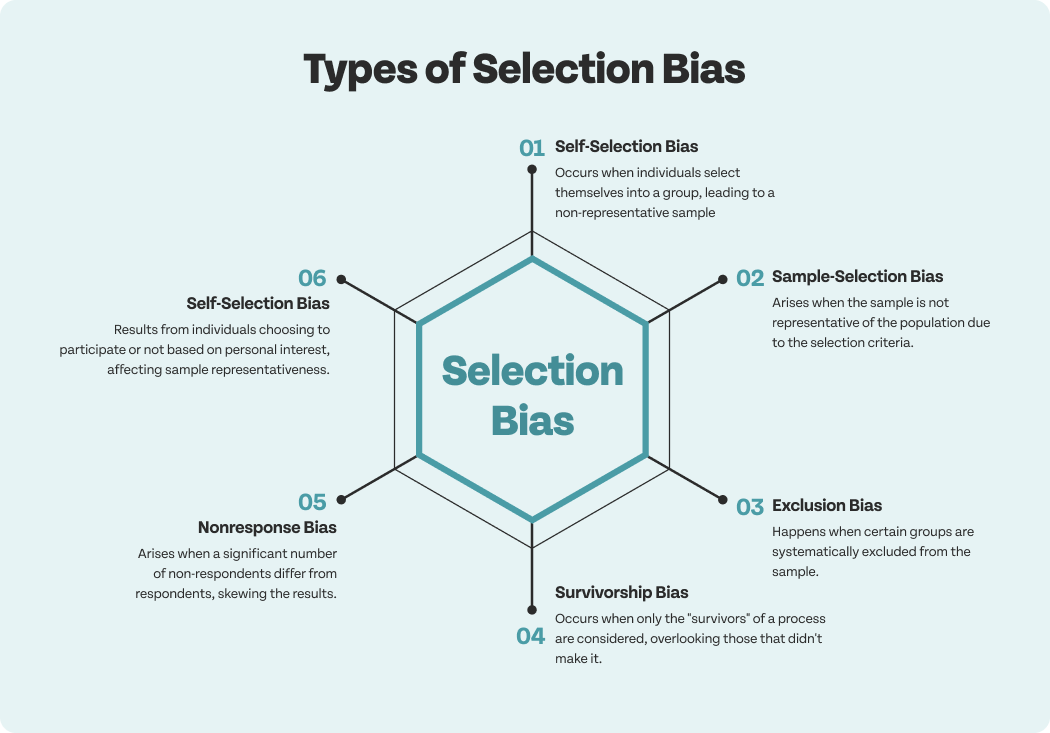
A dataset can contain accurate observations and still support a misleading conclusion. The problem may have started before the first calculation, when someone decided which cases to record. Sports screenshots, app reviews, and memorable session results all make this issue easy to see.
Suppose a researcher starts from https://888starz.bet/fr/mobile while examining how mobile services describe themselves. That page can document the operator’s published claims at the time of inspection. It cannot, by itself, provide a representative sample of users, establish satisfaction, or measure the probability of an individual’s outcome.
The first analytical question is therefore about the observation process. What became eligible for inclusion, and what remained outside the dataset?
A Collection Is Not Automatically a Sample
Imagine asking people to submit their most surprising sports prediction. The resulting collection may be interesting, but the invitation explicitly favors unusual cases. It cannot tell you how often the average prediction succeeds.
The same limitation applies to screenshots of exceptional results. Even if every image is authentic, the collection may omit routine sessions, unsuccessful attempts, and people who never submitted anything. Authenticity and representativeness are separate properties.
Before computing a mean or a success rate, describe the population you want to understand. Then explain how observations entered the dataset. If those two descriptions do not connect, a larger spreadsheet will not automatically solve the problem.
Sometimes the appropriate result is a narrower claim: these are the experiences reported by this particular group under these collection conditions. That can still be useful when its scope is clear.
Missing Observations Need an Explanation
An empty field can mean several things. The event may not have occurred, the recorder may have missed it, or the information may have been unavailable. Replacing every blank with zero silently treats these explanations as equivalent.
In sports data, a missing player statistic should not automatically become evidence of no contribution. In app research, the absence of a review does not tell you whether the person was satisfied, dissatisfied, or simply uninterested in posting.
Create explicit categories where the distinction matters. Record what is unknown rather than manufacturing a complete-looking table from assumptions. Then test whether the missingness could affect the conclusion.
If unsuccessful experiences are less likely to be reported, the visible dataset may look unusually positive. If people mainly post when something goes wrong, the opposite distortion may occur. The direction depends on the collection process.
Different Listings Can Describe Different Contexts
A mobile webpage and a store listing are related sources, but they do not necessarily describe identical environments. Platform, version, language, and regional presentation may differ. Those variables belong in the research design rather than being treated as noise after the results appear.
For example, https://apps.apple.com/ci/app/888starz-pari-sportifs/id6475004245 identifies a particular App Store route. Information observed there should be recorded with its platform and inspection date. It should not be generalized automatically to an Android file, every country, or every release of the product.
Ratings also require context. A score without its observation date and number of ratings is difficult to compare fairly. A change in the visible average can reflect new reviewers as well as a change in the product itself.
The analytical task is to define comparable observations before combining them. Matching names are not enough to establish matching measurement conditions.
A Precise Number Can Still Answer the Wrong Question
Suppose 18 of 20 selected screenshots show a desired result. The arithmetic gives 90 percent for that collection. It does not establish a 90 percent chance for a future participant drawn from a different population.
The denominator is part of the claim. Selected screenshots, all registered users, and all completed sessions are different sets. Replacing one with another in the final wording creates a stronger statement than the calculation supports.
Expected values require the same discipline. A theoretical average based on stated rules does not guarantee a result in a short observed session. A model and a person’s realized experience answer related but distinct questions.
When presenting a percentage, write the denominator in ordinary language next to it. This small editorial choice makes it harder for readers to interpret a narrow statistic as a universal promise.
Preserve the Limits in the Final Conclusion
Preserve a copy of the original observations before making transformations. A transparent record of exclusions and corrections makes it easier to explain how the final dataset was produced.
A useful analysis records definitions, collection conditions, exclusions, and unresolved gaps. These details should remain visible when the result is summarized. Removing them for a stronger headline changes the meaning of the evidence.
You can also compare reasonable alternative assumptions. If a conclusion changes substantially when a few missing cases are treated differently, that sensitivity is worth reporting. It tells the reader where confidence should be limited and what further information would help.
Good data work does not begin by finding an impressive number. It begins by establishing which observations belong together and what they can reasonably tell us. Once those boundaries are clear, the arithmetic has a question it can genuinely answer.