
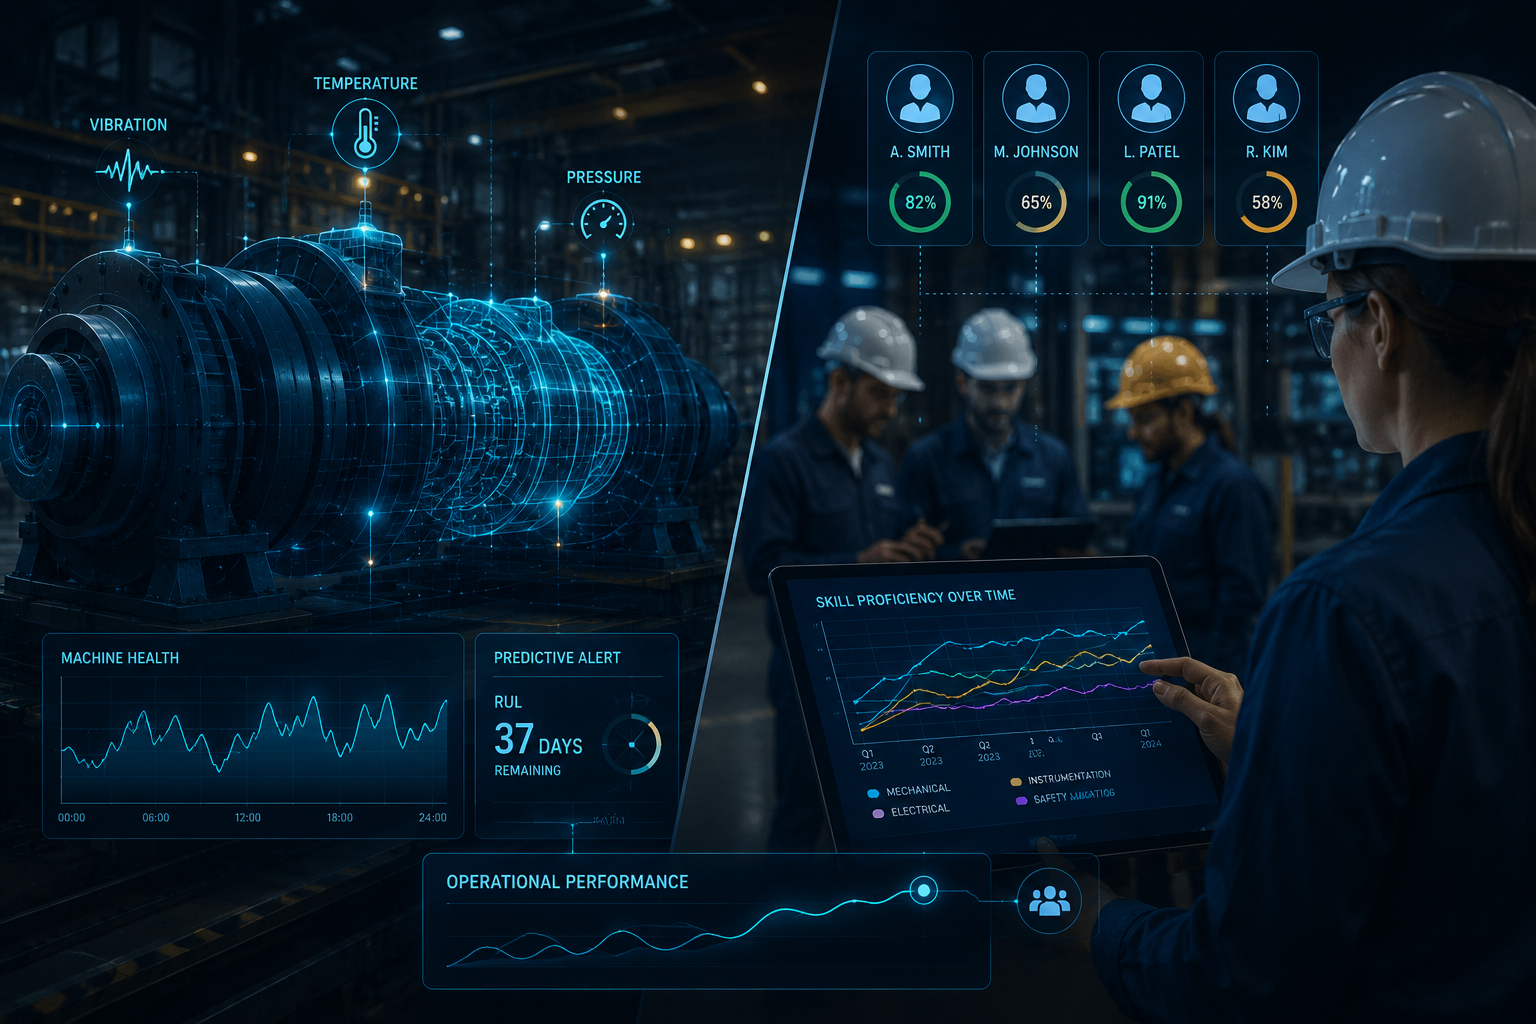
You can model the vibration signature of a motor bearing. You can predict — to within hours — when a transformer will fail. You can fit LSTM networks to current-waveform data and catch a fault in a neutral grounding resistor before it trips the whole grid.
The equipment side of industrial reliability has become a mature data science problem.
The human side has not.
That’s the argument this piece makes. Workforce competence — who is certified, when those certifications expire, and whether the person holding them actually remembers the material — has the same mathematical structure as equipment health data. It’s a time-series problem. But while the equipment side gets SCADA feeds, sensor fusion, and survival analysis pipelines, the workforce side is still tracked in spreadsheets and PDF certificates filed in a shared drive.
That asymmetry is costing lives and uptime. Here’s why it needs to change, and what it would look like to fix it.

What the equipment side of predictive maintenance actually looks like
Start with the problem predictive maintenance (PdM) already solves well. Industrial equipment generates continuous streams of time-series data: vibration, temperature, current draw, acoustic emissions, oil quality. ML models — typically LSTM networks, gradient-boosted trees, or survival analysis models — learn what normal looks like and flag deviations before failure occurs.
Consider neutral grounding resistors as a specific example. An NGR sits between the neutral point of a generator or transformer and ground. Its job is to limit fault current during a line-to-ground fault — a protection role, not a power-delivery role. When it fails, or when it is incorrectly specified or maintained, the fault current it was supposed to constrain can cascade through connected switchgear, motors, and the wider grid segment. It is a relatively simple component with serious system-level consequences.
That makes NGRs a useful illustration of how PdM has matured. Ground fault relay trip histories, temperature rise data under fault conditions, resistance drift over time — these are all time-series signals a monitored power system can collect and a predictive model can learn from. Manufacturers like MegaResistors, who build NGRs and dynamic braking resistors for mining, transit, wind, and industrial plant applications, design these components to operate within specified fault-current and thermal limits. Those limits define what normal looks like in the data — and therefore what an anomaly detection model should be watching for.
The results are compelling. AI-driven predictive analytics can increase failure prediction accuracy up to 90% while reducing maintenance costs by 12%, according to industry research. The global predictive maintenance market reached $10.93 billion in 2024 and is projected to grow to $70.73 billion by 2032.
This is the equipment half. Now let’s look at the half that gets ignored.
Between 80% and 90% of industrial accidents involve human factors — not equipment failure

Here is the statistic that should reframe how data scientists think about industrial risk. Somewhere between 80% and 90% of workplace accidents across industries — manufacturing, construction, electrical, offshore — are attributed to human error or human factors.
A Finnish study found human errors involved in 84% of serious accidents and 94% of fatal incidents. Analysis of offshore crane safety published in April 2026 found that while structural failures account for less than 20% of offshore accidents, 80% are driven by human and organisational factors — including gaps in training depth and personnel qualifications.
This doesn’t mean equipment PdM is irrelevant. It means that even a perfect ML pipeline predicting every component failure won’t prevent the majority of incidents — because the majority of incidents originate on the human side.
Yet the investment in the two halves is wildly asymmetric. Thousands of data science hours go into sensor fusion, anomaly detection, and remaining useful life (RUL) models for equipment. The workforce side gets a spreadsheet of certification expiry dates, checked quarterly, maybe.
Workforce competence has the same data structure as equipment health
Here is the insight that makes this a tractable data science problem: a certification isn’t just a credential. It’s a time-series data point.
Every certification has an issue date, a theoretical expiry date, and an implicit competence decay curve between the two. Skill fade — formally, the deterioration of knowledge and performance due to non-use — is well-documented in safety-critical industries. NATO’s HFM-292 Research Task Group identified 38 factors that influence skill fade, organised into person-related, task-related, and training-related categories. A 2025 paper in the journal Human Factors applied a skill decay prediction model to railway safety workers and generated skill decay curves: quantitative predictions of how competence degrades over time without practice.
That curve is the equivalent of a remaining useful life model for a bearing. It has the same shape. It answers the same question: how much longer before this component (human or mechanical) fails in a safety-critical context?
Map this out for a workforce:
- Certifications have issue dates and expiry dates → equivalent to ‘last maintenance’ and ‘scheduled next maintenance’
- Skills decay at different rates depending on frequency of use → equivalent to wear rates varying by load cycle
- Workers in high-risk contexts with lapsing certifications represent anomalies → equivalent to equipment operating outside normal parameters
- Certification lapses correlate with incident reports → equivalent to sensor anomalies correlating with failure events
None of this is speculative. The UK Rail Safety and Standards Board ran Project T717 specifically to build a model for competence retention in railway workforces. Aviation has been doing this with crew resource management data for decades. The methodology is there. The data pipeline is not.
Why the data pipeline for workforce competence doesn’t exist yet
Ask most large industrial operators where their certification data lives and you’ll get a version of the same answer: some of it is in HR, some in a site-level spreadsheet, some on paper certificates filed with a safety officer. External training — delivered by specialist providers, not the employer directly — often lives with the provider, not the operator.
This fragmentation is the core problem. A predictive model needs clean, structured, queryable data. It needs to know: who was trained, in what, when, at what level, by which provider, and what their role and location are right now. Without that, survival analysis can’t be run, decay curves can’t be modelled, and risk scores can’t be computed.
The solution starts with getting the data layer right. The prerequisite is not a model — it is a structured, queryable record of who was trained, in what, to what standard, by which provider, and when. That data needs to live somewhere that exposes it programmatically, not in a folder of PDFs.
Training management systems exist precisely to solve this. The sectors most exposed to the risk described here — construction, manufacturing, fire and rescue, transport — are also sectors where specialist training providers have moved toward platforms like EduAdmin that give them a structured, API-accessible record of certifications, attendance, and competency data. The point is not that any particular platform is the answer. The point is that once this data is structured and queryable, a data scientist has something to work with: survival analysis on time-to-lapse, anomaly detection for high-risk workforce segments, correlation modelling between certification states and incident reports.
The TMS is not the AI. It is the foundation the AI needs. Right now, that foundation largely does not exist in a form a data pipeline can consume.
What a joint risk model would actually look like

Here is the interesting modelling challenge: what happens when you join the equipment health dataset with the workforce competence dataset?
Consider a simple formulation:
Plant-level risk = P(equipment fault) × P(operator competence gap at fault moment)
Each term is separately estimable with the data we’ve described. P(equipment fault) comes from the standard PdM pipeline — sensor data, LSTM models, survival analysis on component wear. P(operator competence gap) comes from the workforce data pipeline — certification expiry curves, skill decay models, anomaly flags for workers with lapsing credentials in high-risk roles.
The interesting territory is the joint model. When equipment is under stress and the operator team has a competence gap, risk doesn’t add — it multiplies. A fault in a neutral grounding resistor managed by a team whose electrical safety certifications have quietly lapsed is a different situation from the same fault managed by a freshly-trained crew. The equipment model alone misses this.
Building this joint model is a natural datathon problem. The data structure is clean: two time-series datasets, one for components and one for people, joined on plant, date, and role. The modelling approaches are established — survival analysis, anomaly detection, graph models linking certification states to incident reports. What’s needed is the will to treat the two halves symmetrically.
What this means for industrial data scientists
Three practical takeaways.
First, push for the workforce data layer. If you’re working on an industrial reliability problem, ask where the certification data lives. If the answer is ‘spreadsheets’, that’s the highest-leverage intervention available. A structured, API-accessible training management system turns a qualitative HR process into a dataset.
Second, model competence as a continuous variable, not a binary. A worker is not simply ‘certified’ or ‘not certified’. Competence decays. The decay rate depends on how frequently the skill is used, the complexity of the task, and how long ago training occurred. Survival analysis and skill decay curves give you a continuous risk score, not a checkbox.
Third, look for the correlation between workforce anomalies and incident data. In any industrial dataset with both certification records and incident reports, the correlation between lapsing certifications and incident rates is testable. Start there. If the signal is present, the joint model becomes urgent.
The equipment side of industrial reliability is a success story. Failure prediction accuracy up to 90%, maintenance costs down, downtime cut by a third. That work is real and it matters.
But 80% of the accidents are still happening on the other side of the equation. The tools to address it — time-series modelling, survival analysis, anomaly detection — are the same tools the data science community already uses. The data pipeline is the missing piece. Building it is the problem worth solving.
The quiet side of industrial risk worth modelling
The predictive maintenance revolution has been one of industrial data science’s clearest wins. Sensor data, ML pipelines, and survival analysis models have made equipment failure quantifiable and preventable. That’s genuinely valuable.
But industrial safety is a joint system. Equipment and people both fail. Both failures are time-series problems. Both can be modelled, monitored, and predicted. The data science community has built a mature discipline around one of them.