
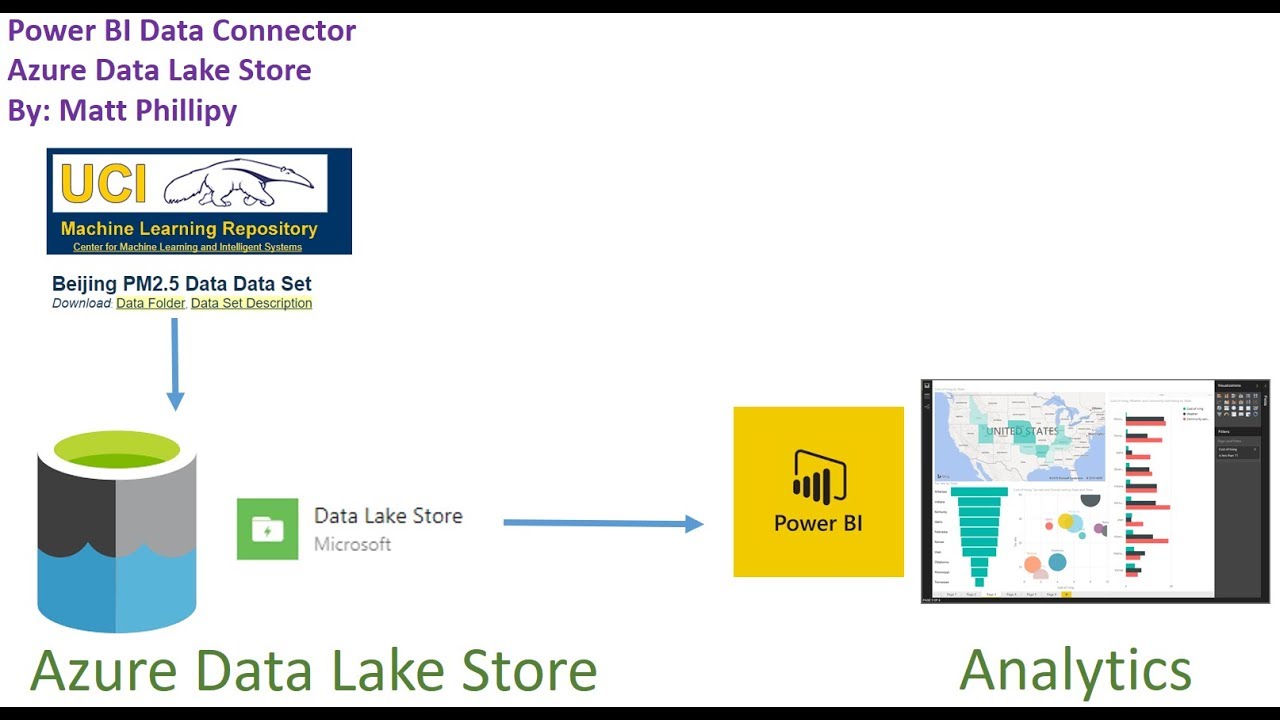
The demand for real-time, scalable, and secure reporting systems is at an all-time high. Organizations are moving away from siloed, spreadsheet-based reports and turning to robust data platforms like Azure Data Lake combined with powerful visualization tools like Power BI. As a data analyst working on end-to-end reporting solutions, I’ve encountered and overcome numerous challenges in building such systems.
This article offers a deep dive into the integration process, enriched with diagrams and real project cases, focusing on scalability, security, and efficiency.
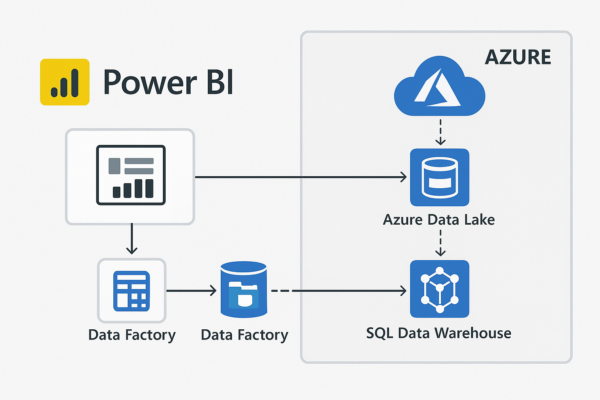
1. The Architecture: Azure Data Lake + Power BI
Our typical architecture consists of:
- Azure Data Lake Storage (Gen2): Raw and cleaned data
- Azure Data Factory: ETL pipeline to move and transform data
- Azure SQL Database or Synapse: Structured data model
- Power BI Service: Visualization, dashboards, and user access
2. Integration Example: Sales Dashboard
Project Context: A retail chain needed a centralized, scalable dashboard aggregating sales, inventory, and financial KPIs across 15+ stores.
Steps:
- Raw sales and inventory data landed in Azure Data Lake from POS systems.
- Azure Data Factory cleaned and normalized the data using scheduled pipelines.
- Transformed data was loaded into an Azure SQL Database.
- Power BI used DirectQuery to connect to SQL, ensuring real-time insights.
Challenges & Solutions:
- Problem: Initial reports were slow due to large dataset size (>20M rows).
- Solution: We created aggregated views in SQL with partitioned tables and switched to Hybrid Tables for high-priority metrics.
- Problem: Some users needed access only to their store’s data.
- Solution: Implemented Row-Level Security (RLS) using
USERPRINCIPALNAME()in Power BI with a user-region mapping table.
- Solution: Implemented Row-Level Security (RLS) using
3. Security with RLS and OLS
Row-Level Security (RLS): Limits what data a user can see based on their identity.
- Used dynamic security roles in Power BI.
- Role definitions linked to region, department, or job level.
Object-Level Security (OLS): Hides entire tables or columns.
- Used for confidential metrics like salaries or strategic KPIs.
- Controlled in Power BI dataset model with Tabular Editor.
Tip: Always test security roles using “View as Role” in Power BI Desktop before publishing.
4. Performance Optimization Techniques
a. Aggregations:
- Materialized aggregated tables in SQL for KPIs by day, region, and product.
b. Incremental Refresh:
- Set up incremental data refresh policies in Power BI for fact tables (e.g., Sales).
- Reduced data refresh time from 2 hours to 15 minutes.
c. Query Folding:
- Ensured Power Query steps translated to native SQL.
- Used
Viewinstead of large queries in Power BI for better folding.
5. Business Questions Answered
Power BI dashboards built on top of this architecture enabled leadership to answer:
- “Which store underperformed last month and why?”
- “What is the weekly sales trend across the top 10 products?”
- “Which regions have shrinking profit margins?”
- “How long does it take to turn inventory into sales?”
6. Lessons Learned
- Design for performance from the start. Poor model design cannot be saved later.
- Secure data access meticulously. RLS/OLS prevents data leaks.
- Build reusable dataflows. They save effort in future reports.
- Collaborate with stakeholders early. Knowing their questions improves report value.
Conclusion
Integrating Azure Data Lake with Power BI provides a scalable, secure, and robust reporting ecosystem when designed well. The architecture must support business needs, and the system must remain maintainable as data volumes and users grow. As a data analyst, mastering these integrations not only delivers value but also positions me as a strategic contributor to data-driven decisions.
My lesson learned: If you’re a data analyst or BI developer, start small with Azure Data Lake and Power BI integration—then scale. Begin with clean architecture, enforce security, and always focus on the business questions behind the dashboard.