
Introduction
As businesses generate and rely on increasingly large amounts of data, effective data management and visualization have become critical to success. Microsoft Power BI dashboards provide businesses with a solution that enhances data interpretation, enables real-time analysis, and fosters data-driven decision-making. This article explores the advantages of Power BI dashboards and how they contribute to maximizing business efficiency and performance across different industries.
1. Consolidating Data into One Centralized Platform
1.1. Bringing Disparate Data Together
One of the key advantages of Power BI dashboards is their ability to consolidate data from various sources into one cohesive platform. Businesses often rely on data from multiple sources—such as customer relationship management (CRM) systems, financial platforms, and e-commerce tools—which can create data silos and complicate analysis. Power BI’s ability to aggregate data from these disparate sources ensures a unified view, providing users with all the insights they need in one place.
1.2. Unified Data for Consistent Decision-Making
The centralization of data enables consistency in decision-making. Instead of different departments working from separate data sets, Power BI dashboards ensure that everyone is working with the same, up-to-date information. This fosters alignment across departments, reducing the likelihood of conflicting decisions based on outdated or inconsistent data.
2. Enhanced Data Visualization and Reporting
2.1. Visualizing Complex Data for Better Understanding
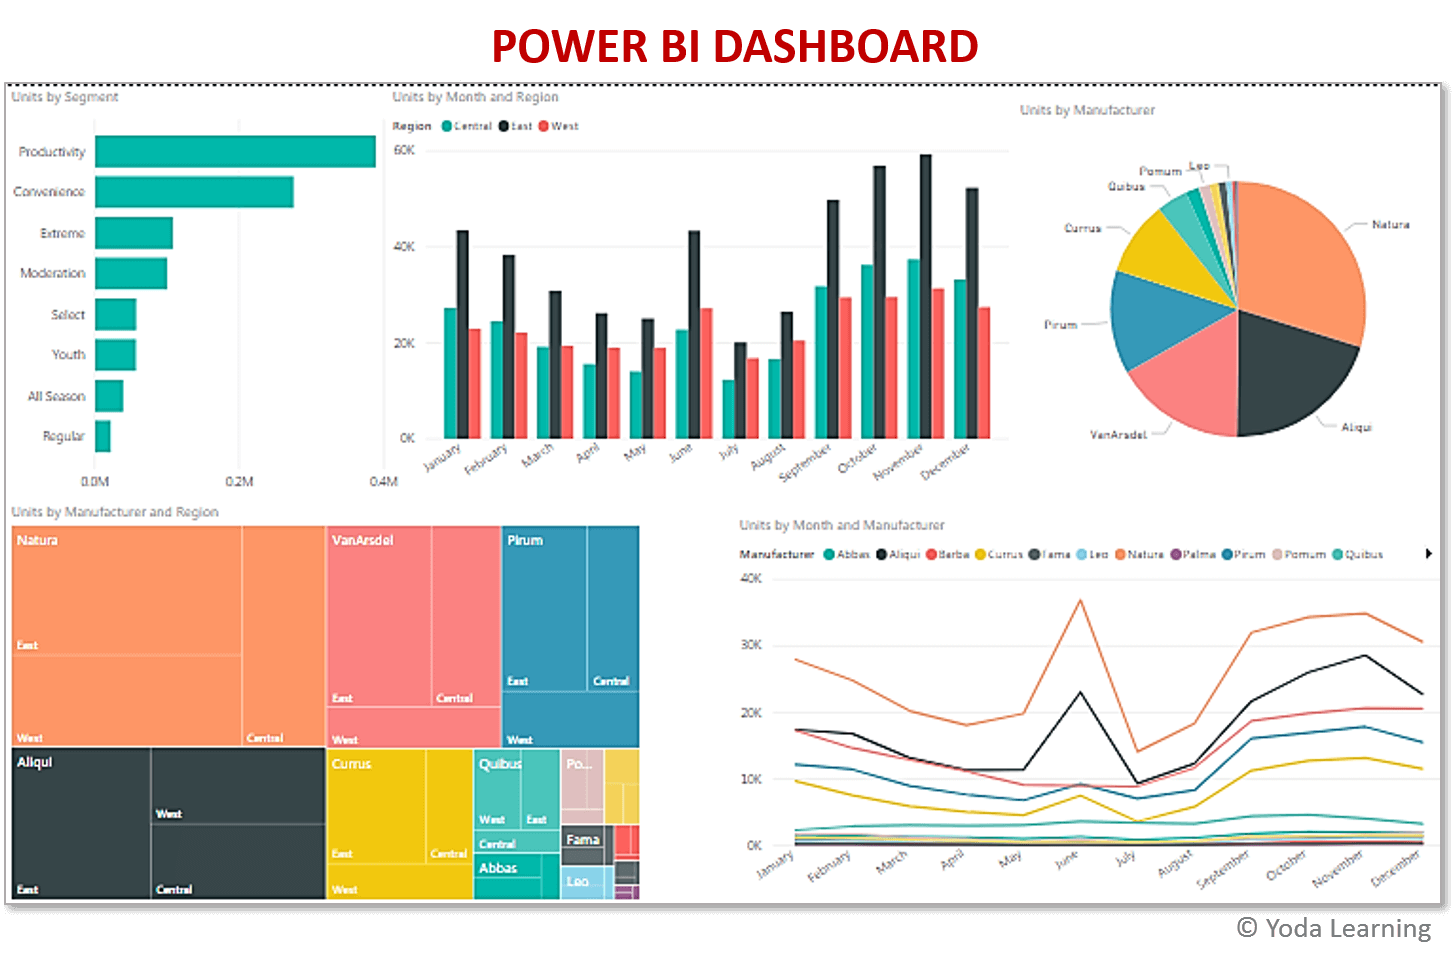
Data visualization is one of the primary benefits of Power BI dashboards. Instead of navigating through endless rows of raw data, users can view the information they need through intuitive and easy-to-understand visuals. Power BI offers a wide range of visualization tools, including bar graphs, pie charts, heat maps, and more, helping users grasp insights quickly and without overwhelming complexity.
2.2. Customizable Reports for Targeted Insights
Power BI dashboards are customizable, allowing businesses to design reports that meet their specific needs. Whether a user needs a high-level overview of company-wide performance or a detailed report on a specific department’s metrics, Power BI provides the flexibility to customize reports to meet those requirements. This ensures that decision-makers can focus on the data that matters most to their roles.
3. Real-Time Data Monitoring and Alerts
3.1. Tracking Key Metrics in Real-Time
One of the most powerful aspects of Power BI dashboards is the ability to monitor key metrics in real-time. With constantly refreshed data, decision-makers no longer have to rely on periodic reports, which may become outdated by the time they are reviewed. Real-time data empowers businesses to act quickly, whether they need to respond to customer demands, address operational inefficiencies, or adjust to market changes.
3.2. Configurable Alerts for Proactive Decision-Making
In addition to real-time monitoring, Power BI dashboards allow users to set alerts for critical metrics. For example, businesses can configure alerts to notify them when sales drop below a certain threshold, inventory levels become critically low, or specific KPIs are exceeded. This feature helps businesses stay proactive, enabling them to address potential issues before they become larger problems.
4. Facilitating Better Collaboration Across Teams
4.1. A Collaborative Data Environment
Power BI dashboards foster collaboration across teams by allowing multiple users to access and interact with the same data. Whether it’s a sales team monitoring performance or an operations team reviewing productivity metrics, Power BI ensures that everyone has access to the same insights. This shared data environment improves communication between departments and encourages cross-functional collaboration.
4.2. Role-Based Access for Data Security
While collaboration is essential, data security is equally important. Power BI provides role-based access controls, ensuring that sensitive data is only accessible to those who need it. Administrators can assign specific permissions to different users, controlling who can view, edit, or share data. This balance between collaboration and security helps organizations protect sensitive information while still promoting teamwork.
5. Driving Efficiency Through Automation
5.1. Automated Data Refreshes
Manually updating data is a time-consuming process that can lead to delays and errors. Power BI eliminates this issue by automating data refreshes. This ensures that dashboards are always displaying the most current information, without the need for manual intervention. With automated refreshes, decision-makers can trust that they are working with accurate and up-to-date data at all times.
5.2. Streamlined Reporting Processes
In addition to automating data refreshes, Power BI also automates the reporting process. Users can schedule reports to be generated and distributed at regular intervals, such as daily, weekly, or monthly. This reduces the administrative burden of manually creating and distributing reports, saving time and improving efficiency.
6. Data-Driven Decision-Making for Improved Performance
6.1. Data as a Strategic Asset
Power BI dashboards help businesses unlock the true value of their data. By transforming raw data into actionable insights, companies can use data as a strategic asset. Whether it’s optimizing marketing strategies, improving customer satisfaction, or streamlining operations, Power BI dashboards empower businesses to make informed, data-driven decisions that drive performance improvements.
6.2. Enhancing Agility with Faster Decisions
In a fast-paced business environment, agility is key to staying competitive. Power BI dashboards enable businesses to make decisions faster by providing instant access to critical data. This ability to respond quickly to changing circumstances—whether it’s market trends, customer preferences, or operational challenges—helps businesses stay ahead of the competition.
7. Scalability for Growing Businesses
7.1. Adapting to Business Growth
Power BI dashboards are highly scalable, making them suitable for both small businesses and large enterprises. As a company grows and its data needs evolve, Power BI can scale to accommodate more users, more data sources, and more complex analyses. This scalability ensures that Power BI remains an effective solution as businesses expand.
7.2. Supporting Enterprise-Level Operations
For larger organizations, Power BI Premium offers advanced features that support enterprise-level operations, such as enhanced data capacity, advanced analytics, and dedicated cloud resources. These features ensure that even the most complex data environments can be managed effectively, providing large-scale businesses with the tools they need to continue driving growth.
8. Integration with Other Business Tools and Applications
8.1. Seamless Integration with Microsoft Tools
Power BI dashboards seamlessly integrate with other Microsoft tools, such as Excel, Azure, and Dynamics 365. This integration ensures that businesses can leverage their existing Microsoft ecosystem to maximize the value of their data. For example, Excel users can import and analyze data in Power BI with just a few clicks, while Azure users can incorporate advanced analytics into their dashboards.
8.2. Extending Power BI with Third-Party Applications
In addition to Microsoft tools, Power BI also integrates with a wide range of third-party applications, such as Salesforce, Google Analytics, and QuickBooks. This flexibility allows businesses to extend the capabilities of Power BI dashboards by connecting to the tools they already use. By integrating data from these platforms, businesses can create a more comprehensive view of their operations, customers, and performance metrics.
9. Advanced Analytics and Predictive Insights
9.1. Leveraging AI and Machine Learning
Power BI dashboards go beyond descriptive analytics by integrating advanced AI and machine learning capabilities. These features allow businesses to perform predictive analytics, forecasting future trends and behaviors based on historical data. For example, a company can use Power BI to predict future sales performance, customer churn, or demand fluctuations, helping them make more informed strategic decisions.
9.2. Simplifying Complex Analysis
Advanced analytics doesn’t have to be complicated. Power BI’s AI-driven insights simplify complex analyses, allowing users to ask natural language questions and receive instant visual answers. For instance, a user can ask, “What was our best-selling product last quarter?” and Power BI will generate a visual response that answers the question. This functionality makes advanced analytics accessible to all users, regardless of their technical expertise.
10. Use Cases of Power BI Dashboards Across Industries
10.1. Financial Services
In financial services, Power BI dashboards provide critical insights into revenue, profitability, risk management, and compliance. By consolidating financial data from multiple systems, Power BI enables financial institutions to track performance in real-time, identify risks, and optimize their portfolios.
10.2. Manufacturing
For manufacturing companies, Power BI dashboards help monitor production metrics, supply chain performance, and inventory levels. By providing real-time visibility into operations, manufacturers can identify bottlenecks, reduce waste, and improve overall efficiency. Additionally, predictive analytics can forecast demand, ensuring that production levels align with market needs.
10.3. Healthcare
In healthcare, Power BI dashboards are used to track patient outcomes, resource utilization, and operational efficiency. Hospitals and clinics can integrate data from electronic health records (EHRs), financial systems, and patient surveys to gain insights into patient care and optimize resource allocation.
Conclusion
Power BI dashboards are an invaluable tool for businesses looking to maximize efficiency and performance. From real-time data monitoring and customizable reports to advanced analytics and seamless integration with other tools, Power BI empowers businesses to make data-driven decisions that enhance agility, collaboration, and strategic planning. By leveraging the power of data, businesses can stay competitive and continuously improve their operations, no matter their industry or size.