

In a world inundated with information, finding innovative ways to present data can make all the difference. Utilizing effective data visualization tools like map charts can give your presentations an edge. Below, we begin a deeper dive into understanding map charts, how to create them, map chart best practices, and their benefits for your business.
Understanding Map Charts and Their Importance

Alt Text: A man using a small map chart.
Map charts, also known as geographical maps or geo charts, are visual representations of data related to geographic areas. They can show anything from climate patterns to political terrain or population density.
Making sense of raw data can be a daunting task. Map charts add a geographic dimension to data analysis, offering a spatial perspective that makes the extraction of insights easier and more effective. This becomes especially useful in domains such as geospatial analysis, where location matters substantially.
Moreover, the usage of map charts can significantly contribute to decision-making processes. They allow users to spot trends, patterns, and outliers that can provide valuable insights.
Employing map charts isn’t solely about better data comprehension. They also aid in communication, making it easier to explain complex data sets. A good map chart can tell a story, one that can influence decisions and orient strategies.
As businesses expand globally, Map Charts prove invaluable not only for visualizing geographic data but also for strategic decision-making, offering insights into factors such as regional market trends, accessibility, and moving costs.
Essential Features To Create a Competent Map Chart
Not all map charts are created equal. An effective map chart is both accurate and user-friendly, presenting data in a way that is easy to understand and interpret.
One key feature of an exceptional map chart is color usage. Colors should correspond logically to the data, with obvious differences or gradients to distinguish varying data values.
Another critical element is scale. If data is not represented at an appropriate scale, it can lead to misleading interpretations. Balance is crucial here; the scale should be large enough to exhibit important details without overwhelming viewers with unnecessary information.
Common Mistakes To Avoid When Creating Map Charts
The misuse of color is a common pitfall when creating map charts. Avoid using excessively bright or pastel colors that can make your chart hard to read. Equally important is avoiding using colors that convey cultural or societal biases.
Using an improper scale can also lead to errors. If the scale is too large or too small, it may distort the data, leading to a misleading interpretation of the information presented.
Ignoring data cleaning can be another mistake made when creating map charts. This step is critical to ensuring that the data is accurate, reliable, and free from errors or discrepancies.
The Role of Map Charts in Boosting Business Intelligence
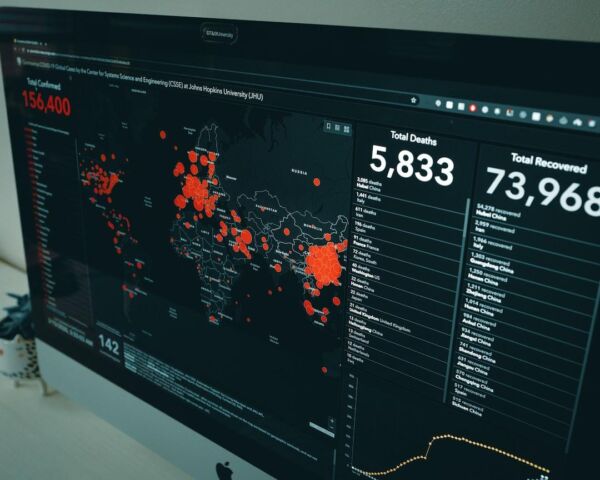
Alt Text: A map chart showing health record data.
The strategic application of map charts can profoundly boost business intelligence. By transforming raw data into meaningful insights, they empower businesses to make informed, data-driven decisions.
Location analytics, for example, can benefit immensely from map chart visualizations. Such charts can reveal trends or anomalies in geographic data that can inform strategic initiatives, from marketing campaigns to supply chain management.
In the realm of risk management, map charts can visually represent risk distributions across various locations, aiding businesses in identifying potential areas of concern.
Moreover, map charts’ interactive features can increase engagement and foster a sense of exploration, further inviting users to plunge deeper into the data to discover more insights.
Altogether, the right usage of map charts can be a game-changer in conveying complex data, making them a must-have in any data enthusiast’s toolkit. Their beneficial role in enhancing the comprehensibility and interactivity of data places them at the center of effective business intelligence.