
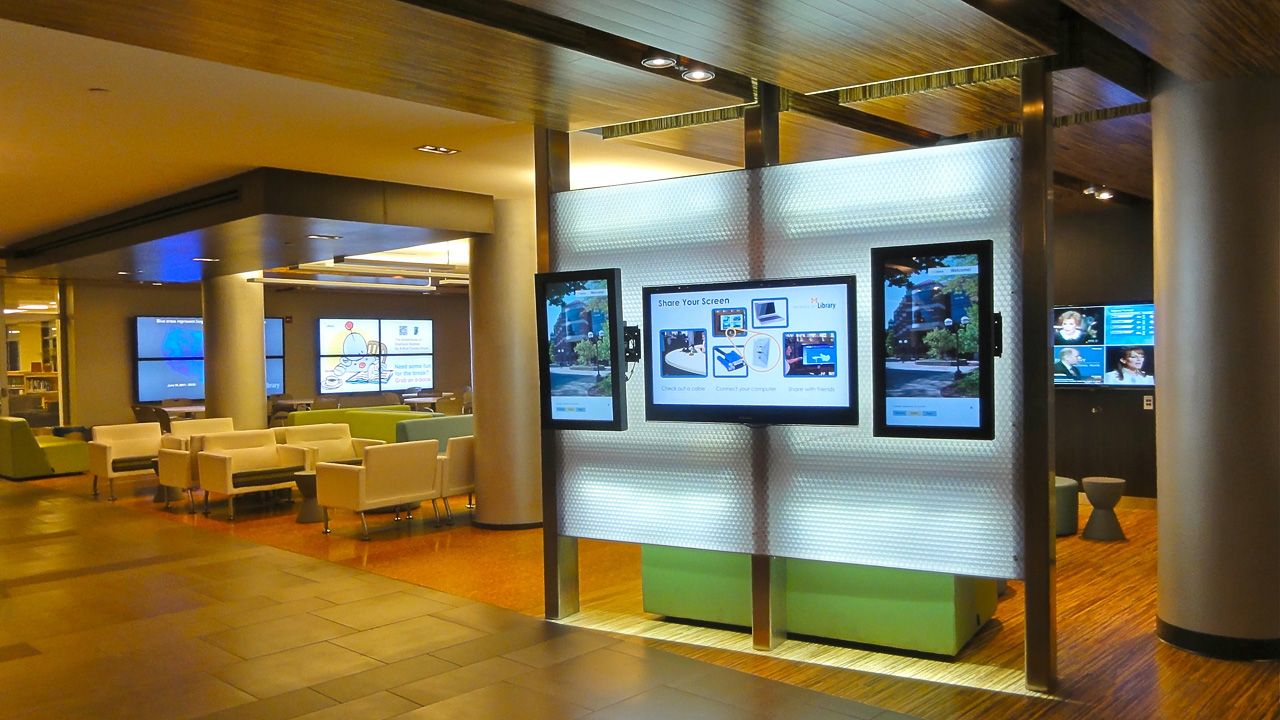
In an era where data visualization can make or break business decisions, there’s a quietly powerful technology transforming how organizations communicate information: digital signage. While data scientists obsess over algorithms and machine learning models, the final mile of data delivery—getting insights in front of the right people at the right time—often gets overlooked. Digital signage is changing that narrative.
The Data Display Disconnect
Here’s the truth: your brilliant data analysis is only as good as its delivery mechanism. You can build sophisticated predictive models and derive game-changing insights, but if your audience is staring at static slides from last quarter, you’re fighting an uphill battle.
Digital signage bridges this gap by turning data into dynamic, contextual experiences. It’s the difference between reading yesterday’s weather report and looking out the window—both tell you about conditions, but only one is actually useful.
Beyond Fancy Screens: Real Business Intelligence
When most people hear “digital signage,” they picture flashy displays at airports or menu boards at fast-food chains. But the real magic happens when you combine display technology with real-time data streams and smart content management.
Take retail, for instance. A well-implemented retail solution doesn’t just show pretty product photos—it can display inventory levels, customer traffic patterns, conversion rates, and even predictive analytics about purchasing behavior. The screen becomes a dashboard that responds to what’s happening on the floor, right now.
This isn’t theoretical. Retailers are using computer vision combined with digital signage to create feedback loops that would make any data scientist smile. Customer dwell time increases near a display? The system learns. Product placement optimization? The screens test and adapt. It’s A/B testing in the physical world, automated and continuous.
The Corporate Intelligence Revolution
Inside the corporate world, traditional dashboards have a problem: nobody looks at them unless forced to. Static reports gather dust. But corporate tools that leverage digital signage are changing this.
Imagine walking into your office and seeing real-time KPIs, project statuses, and team achievements displayed on elegant screens. Not buried in an email, not requiring a login—just there, ambient and accessible.
When data becomes part of the physical environment, it gets internalized differently. Teams start thinking in metrics naturally. The data culture you’ve been trying to build through workshops? It might just need better visibility.
Event Intelligence: Where Timing is Everything
If you’ve ever organized a conference or large-scale event, you know the chaos of managing thousands of moving pieces. Digital signage for events represents one of the most compelling use cases for combining data analytics with display technology.
Modern event signage systems can integrate with registration databases, social media feeds, attendee tracking systems, and even sentiment analysis tools. That screen showing the conference schedule? It’s actually pulling from a CMS that’s updating based on speaker arrivals, room capacity sensors, and attendee app interactions.
The data opportunities are enormous. Heat mapping shows which sessions attract crowds. Dwell time analytics reveal which sponsor booths are actually engaging attendees. Social media integrations create feedback loops that make events more interactive. Every screen becomes both an output device and a data collection point.
Banking on Better Communication
Few industries are as data-intensive as banking, yet digital signage for banking is proving transformative.
Modern bank branches feature queue management systems that predict wait times using machine learning, screens displaying personalized financial products based on demographic data, and interest rate displays that update automatically with central bank decisions.
The real innovation is in compliance and security. Digital signage systems can integrate with fraud detection systems, display auto-updating regulatory notices, and adjust messaging based on customer segment data from the bank’s CRM.
The Data Science Opportunity
Here’s where it gets interesting: digital signage platforms are becoming sophisticated data consumers. They need predictive models to determine what content to show and generate massive behavioral datasets that need analysis.
The intersection of IoT sensors, computer vision, and audience analytics creates a playground for data science applications. Edge computing at displays, reinforcement learning for content selection, and natural language processing for generating dynamic content from data feeds.
The Future is Dynamic
Static information is dying. Whether it’s retail, corporate, events, or banking, organizations are recognizing that data displayed once is data wasted. The future belongs to systems that think, adapt, and respond.
Digital signage isn’t just about bigger, brighter screens—it’s about creating intelligent surfaces that serve the right information at the right moment. For data scientists and analysts, it represents an opportunity to extend their work beyond dashboards and reports into the physical spaces where decisions actually happen.
The question isn’t whether your organization will adopt dynamic data display systems. It’s whether you’ll be part of designing them, or just watching from the sidelines as others transform how data gets seen, understood, and acted upon.
Because in the end, data that isn’t seen might as well not exist. And data that’s seen at the right moment? That’s the kind that changes everything.