
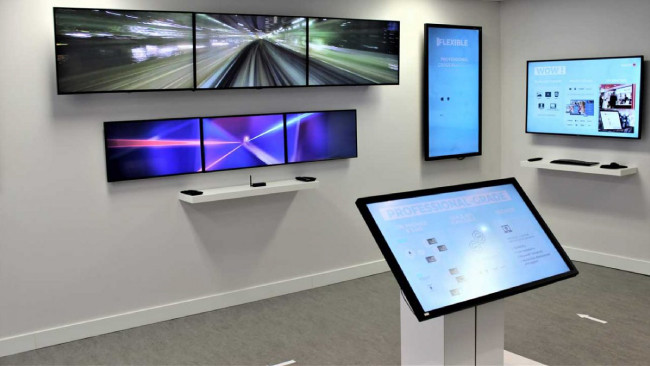
Digital signage has evolved far beyond simple electronic billboards. Today’s intelligent display systems represent a convergence of data science, machine learning, and real-time analytics that’s revolutionizing how organizations communicate with their audiences. From predicting customer behavior to optimizing content delivery, data science has become the backbone of modern digital signage networks across multiple industries.
The transformation of digital signage into a data-driven technology demonstrates how practical applications of analytics, computer vision, and predictive modeling create measurable business outcomes. Understanding these systems offers valuable insights into real-world data science implementations that impact millions of people daily.
Data-Driven Decision Making in Corporate & Retail Environments
The Corporate & Retail sector exemplifies how data science transforms digital signage from passive displays into intelligent communication systems. Retailers now deploy sophisticated analytics platforms that process vast amounts of customer interaction data to optimize display content in real-time.
Machine learning algorithms analyze foot traffic patterns, dwell times, and conversion rates to determine which content generates the most engagement. Computer vision technologies track customer demographics and attention metrics, enabling dynamic content adjustment based on audience composition. A clothing retailer might automatically switch between women’s and men’s fashion content based on detected viewer demographics, while measuring the correlation between display interactions and actual purchases.
Predictive analytics models forecast peak shopping times and adjust promotional content accordingly. Time-series analysis helps retailers understand seasonal patterns and optimize inventory-related messaging. Meanwhile, A/B testing frameworks continuously experiment with different content variations, creating data feedback loops that improve campaign performance over time.
In corporate settings, data dashboards visualize key performance indicators across office locations, while sentiment analysis tools monitor employee engagement with internal communications. These applications demonstrate how digital signage serves as both a communication channel and a data collection platform.
Machine Learning Behind Digital Menu Boards
The quick-service restaurant industry’s adoption of Digital Menu Boards showcases some of the most sophisticated applications of data science in digital signage. These systems integrate multiple data streams—point-of-sale transactions, inventory levels, weather data, and customer ordering patterns—to deliver personalized menu experiences.
Recommendation algorithms analyze historical transaction data to predict optimal product placement and suggest complementary items. Natural language processing models evaluate customer reviews and feedback to identify trending menu items. Dynamic pricing algorithms adjust prices based on demand forecasting models, inventory levels, and competitive analysis.
Weather data integration demonstrates practical predictive modeling: machine learning systems correlate temperature, precipitation, and seasonal patterns with product demand. A coffee chain’s algorithm might automatically promote iced beverages when temperatures exceed certain thresholds while highlighting hot soups during cold, rainy weather.
Queue management systems employ computer vision and predictive analytics to estimate wait times and adjust menu complexity during peak hours, optimizing both customer experience and operational efficiency. These systems generate massive datasets that enable continuous model improvement through reinforcement learning approaches.
Healthcare Analytics and Patient Communication Systems
The healthcare digital signage sector leverages digital signage as part of broader health informatics initiatives, where data science improves patient outcomes and operational efficiency. Hospital digital signage systems integrate with electronic health records, appointment scheduling databases, and facility management systems to create intelligent patient communication networks.
Predictive analytics models forecast patient volumes and dynamically update wait time displays with remarkable accuracy. Anomaly detection algorithms identify unusual patterns in emergency department traffic, triggering appropriate staffing alerts and patient communication updates.
Natural language processing systems analyze patient feedback collected through interactive displays, identifying trends in patient satisfaction and areas requiring operational improvements. Meanwhile, wayfinding systems employ graph algorithms and indoor positioning technologies to provide optimized routing through complex medical facilities.
Data visualization techniques transform complex health statistics into easily digestible infographics displayed in waiting areas, promoting health literacy. These displays can be personalized based on clinic specialization—pediatric clinics show child health information while cardiology centers display heart health data.
Privacy-preserving analytics ensure that while systems collect valuable interaction data, patient confidentiality remains protected through techniques like differential privacy and anonymization.
Educational Technology and Data-Informed Campus Communications
Education digital signage institutions harness digital signage as part of learning analytics ecosystems that enhance student engagement and campus operations. Universities deploy networks of interactive displays that function as data collection points while delivering personalized content to students, faculty, and visitors.
Student attendance tracking systems use proximity sensors and computer vision to understand traffic patterns across campus, informing optimal placement and timing for event announcements and academic deadlines. Clustering algorithms segment student populations based on majors, interests, and behaviors to deliver targeted content about relevant clubs, research opportunities, and career events.
Sentiment analysis models process social media data and campus feedback to identify trending topics and student concerns, enabling administrators to address issues proactively through strategic messaging. During exam periods, predictive models forecast library occupancy and display real-time capacity information, helping students plan their study sessions efficiently.
Interactive displays in STEM buildings often showcase real-time data science projects, visualizing student research through dynamic charts and dashboards. These applications transform digital signage into educational tools that demonstrate practical data applications while serving communication needs.
The Data Science Stack Powering Digital Signage
Modern digital signage networks rely on comprehensive data science stacks including cloud computing platforms for scalable processing, time-series databases for handling continuous sensor data, and edge computing for real-time inference. Content management systems integrate with data pipelines built using frameworks like Apache Kafka for streaming data and Apache Spark for distributed analytics.
Machine learning models deployed to digital signage systems are typically lightweight, optimized for edge devices through techniques like model quantization and pruning. These systems exemplify how data science transitions from research environments to production deployments serving real users.
Conclusion
Digital signage represents a practical application domain where data science directly impacts business outcomes and user experiences. Whether optimizing retail sales, improving restaurant operations, enhancing patient care, or modernizing campus communications, these systems demonstrate the tangible value of analytics, machine learning, and intelligent automation in solving real-world challenges