
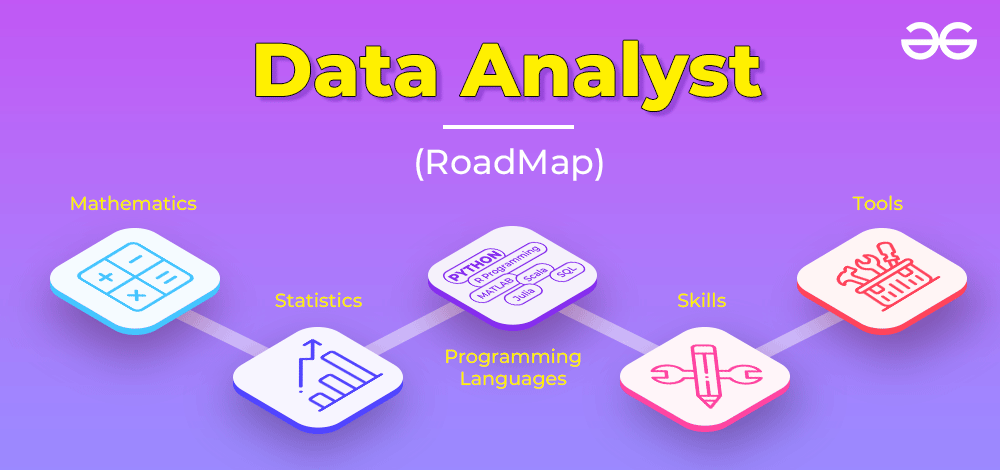
Getting into data analysis? It helps to understand some basic terms that are used every day in the field. Data analysis is all about working with data to find useful insights, which can then be used to make better decisions. The process usually follows six steps: asking the right questions, gathering data, preparing it for analysis, studying it, sharing the results, and using those insights to take action.
Data analysts play an important role in this process. They collect, clean, and interpret data to help businesses solve problems and make informed choices. They often work alongside data scientists and data engineers to turn raw information into something valuable.
This guide will introduce you to some important terms that every beginner in data analysis should know. Whether you’re starting fresh or looking to build on what you already know, these terms will help you navigate the field with more confidence.
Top 10 Basic Terms All Data Analysts Should Know
If you’re working with data, there are a few terms you’ll come across all the time. Understanding them makes it easier to communicate with your team and work more efficiently.
1. Dashboard
Think of a dashboard as your control center for data. It’s where all the numbers, charts, and graphs come together in one place, making it easier to spot trends and patterns. A well-designed dashboard turns raw data into something visual and understandable, helping businesses make informed decisions.
If you’re a data analyst, chances are you’ve spent a lot of time creating dashboards, tweaking them, and making sure they display information the right way.
2. Data Collection
Before any analysis can happen, data needs to be gathered. This process is called data collection, and it can take many forms. It might be survey responses, website clicks, sales numbers, or even sensor readings from a physical location.
A major part of a data analyst’s job is making sure the data is collected properly—securely, without errors, and in a way that makes it useful for analysis later on.
3. Data Blending
Not all data comes from one place. Businesses often gather information from different sources—spreadsheets, databases, customer feedback forms, or website traffic reports.
Data blending is the process of combining these different sets of information into one clear and organized dataset. By blending data, analysts can uncover connections that wouldn’t be obvious if the data remained separate.
4. Data Modelling
Data can be overwhelming if there’s no structure to it. That’s where data modelling comes in. It’s a way of mapping out how different pieces of data are related and how they should move through a system.
Using diagrams, symbols, and text, data models help analysts and developers see the bigger picture and plan how to process and analyze the information effectively. Once you know how data flows, you can decide the best way to use it for insights and decision-making.
5. Data Mining
Data mining is all about digging through large amounts of information to find useful patterns and trends. Businesses rely on this to spot opportunities, predict customer behavior, and make informed decisions.
As a data analyst, you’ll be working closely with data to uncover these insights and help organizations make sense of their numbers.
6. Data Monitoring
Keeping track of data quality is a big part of an analyst’s job. Data monitoring means regularly checking how data is collected and stored to make sure it’s accurate, consistent, and formatted correctly.
When data is well-organized from the start, businesses save time and effort by avoiding errors that could slow down analysis later.
7. Data Extraction
Before data can be analyzed, it first needs to be pulled from its original source. This process is called data extraction. The data might come from databases, spreadsheets, or even online sources.
At this stage, the information is often unstructured, meaning it’s not yet in a clean or organized format. Once extracted, it can be processed and prepared for analysis.
8. Data Validation
Raw data isn’t always reliable, so it’s important to check whether the information is accurate and makes sense. This step, known as data validation, ensures that the data being used is correct and useful.
For example, in Excel, validation rules can be set so only certain types of data can be entered in a cell. This helps prevent mistakes and keeps the dataset clean.
9. Data Transformation
Not all data is ready for use right away. Often, it needs to be adjusted or reformatted to match the system where it will be stored or analyzed. This is called data transformation.
For example, if a company is moving data to a cloud-based storage system, the format might need to change so that it works with the new platform. This step ensures that data is structured properly and can be analyzed without issues.
10. Forecasting
Forecasting is an important part of data analysis. It helps in making informed decisions about the future by studying past and present data. Whether it’s predicting sales, market trends, or customer behavior, forecasting gives a glimpse of what’s likely to happen next.
There are different ways to approach forecasting, and the method you choose depends on the type of data you’re working with.
- Qualitative forecasting is useful when historical data isn’t available or isn’t directly relevant. It relies on expert opinions, market research, and other non-numerical insights.
- Quantitative forecasting is used when working with numbers. It involves mathematical models and statistical techniques to identify patterns and trends in data.
Understanding when to use each method is important for making accurate predictions. The right approach can help businesses and organizations plan better, reduce risks, and make smarter decisions.
Closing Thoughts
Learning these terms is a good first step in becoming comfortable with data analysis. The more you work with data, the more these concepts will start to feel natural. Over time, they will help you ask better questions, find useful insights, and make sense of the numbers in front of you.