

A Practical Guide to Becoming a Data Scientist in 2026
Learn how to become a data scientist in 2026 with a clear roadmap covering stats, Python, SQL, ML, projects, and interview prep. Start today.
Learn how to become a data scientist in 2026 with a clear roadmap covering stats, Python, SQL, ML, projects, and interview prep. Start today.

In the current data-centric market, it is a critical decision for the technology leaders to select between hiring a data scientist or […]
All kinds of organizations are rushing to incorporate AI into their products and work processes. Nevertheless, the vast majority of AI initiatives […]
In the fast-evolving landscape of artificial intelligence (AI) and machine learning (ML), data labeling plays a foundational role, especially in supervised learning. […]
Every time you use a service like Netflix or Google Maps to find the best route for your trip or to suggest a movie based on your watching preferences, data science is at work.
NYC offers high-paying data scientist jobs across industries, requiring strong technical skills and analytics expertise.

In the article “Linear and Logistic Regression: Building Predictive Models in Thane,” we explore essential techniques of linear and logistic regression that form the core tools in predictive modeling in data science.
NLP has come a long way from the early rule-based systems to the modern neural networks. It provides guidelines to practitioners for choosing models that can accomplish different NLP tasks and points out the strengths and deficiencies of various approaches. Following this, the paper traces back the recent rise of machine learning and deep learning techniques and discusses the possibilities in handling the complexity of human language and fitting new data.

This paper focuses on data visualization as a means of creating insightful, compelling stories that convey meaning. Displayed will be many of the techniques of data visualization in use today, such as heatmaps, Sankey diagrams, and network graphs, together with their applications and best practices for effective use. The article insists that the proper visualizations should be picked, adhering to design principles, and data combined with narrative for engaging data stories.
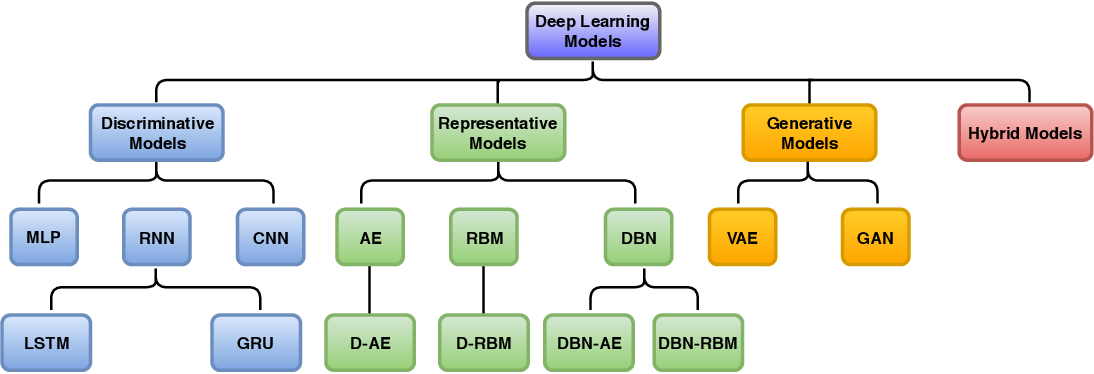
Deep learning, per se, involves that department of machine learning that deals with artificial neural networks to model complicated patterns in data. Deep learning models automatically learn the hierarchical representations of input data through multiple layers of interconnected nodes, unlike traditional machine learning algorithms, for which feature extraction has to be explicitly done. This has made deep learning particularly good at tasks like image classification, speech recognition, and natural language processing, where it is desired that the model learn from raw data.

The article presents the role of data visualization in making information more accessible, provoking viewers’ emotions, and enhancing the collaboration process. The current landscape of leading data visualization tools such as Tableau, D3.js, Power BI, and Google Data Studio is explored, together with explanations of their distinctive features and possibilities. Best practices for creating an interesting visualization are presented, which include knowing your audience, proper selection of the type of visualization, keeping the design simple, using color wisely, and appropriate context setting.