
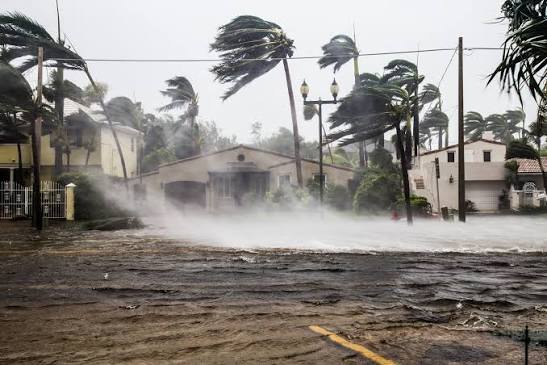
Every June, Florida homeowners hear the same question from their insurer, their lender, and their neighbors: how bad could it get? Prediction models try to answer it. They don’t guess. They simulate thousands of storms, test how each part of a house holds up, and turn the results into dollar estimates. Insurers use those numbers to set premiums. State regulators use them to check whether rates are fair. Homeowners rarely see them, but they shape what you pay and what gets covered. This article explains how these models work, what data goes in, where they fall short, and what recent storms have taught the people who build them. You don’t need a math background. You just need to know enough to read an insurance quote, ask better questions, and decide which upgrades to your home are worth the money. That choice matters, and the models can help you make it.
What a Hurricane Loss Model Actually Does
A hurricane loss model answers one question: if a storm of a certain strength hits this home, how much will repairs cost? It doesn’t predict a single storm. It looks at the full range of storms that could hit an area and estimates the average yearly loss and the worst-case loss.
Insurers use the results to set rates and decide how much reinsurance to buy. Florida regulators use them to review rate filings. Emergency managers use them to plan.
The Three Parts Inside Most Models
Most models have three pieces that work in order:
- Wind: simulates storm tracks and wind speeds at each location
- Vulnerability: estimates how much damage a building takes at each wind speed
- Loss: turns that damage into insured dollars after deductibles and policy terms
Florida’s public model, built at Florida International University, follows this setup. The Florida Commission on Hurricane Loss Projection Methodology certifies it, and the commission reviews the science, engineering, actuarial work, and statistics behind it. The model was recertified in 2023.
It also estimates probable maximum loss, which is the size of a rare, severe event. Insurers use that number to decide how much reinsurance they need.
How the Model Builds a Storm
There isn’t enough real hurricane history to measure risk for a single ZIP code. So the models create storms. Using historical records, they simulate thousands of hurricanes, each with its own track, speed, and strength. Then they calculate the wind each home would feel in every one of them.
That gives a long list of possible outcomes. Some storms barely touch a neighborhood. A few hit it hard. The model weighs each one by how often it’s likely to happen.
What Data Goes Into a Single Home Estimate
The model needs facts about your house. Common inputs include:
- Location and distance from the coast
- Year built and the building rules in force then
- Roof shape, covering, and deck type
- Wall material and number of stories
- Type of opening protection
- Ground elevation, for flood models
Missing details get filled in with averages for that area and building era. That’s one reason a documented inspection can change your result.
How a House Gets Broken Into Parts
The vulnerability piece is where most of the engineering sits. The Florida public model uses a component approach instead of relying only on past claims. It looks at each part of a home and what that part can handle. Then it runs a Monte Carlo simulation, which repeats the same scenario many times with slightly different values, and compares the strength of each part to the wind load on it.
Parts it checks include:
- Roof covering and roof deck
- How the roof connects to the walls
- Windows, doors, and garage doors
- Wall construction
- Shutters or other opening protection
The output is a damage ratio. That’s the repair cost divided by the building’s value. A ratio of 0.10 means repairs cost about 10 percent of the home’s value. The model builds a table of damage ratios for every wind speed.
Why Openings Matter So Much
Wind doesn’t have to destroy a house to ruin it. If a window or door fails, wind and rain get inside. Pressure builds under the roof, and water soaks the interior. The Florida model tracks wind, rain, and damage to the building shell together to estimate interior losses, because water often adds more cost than the wind itself.
This is why opening protection carries weight in these models. A homeowner comparing impact windows Fort Lauderdale options is paying for something the models treat as a real cut in expected damage, not just a nice feature. Wind mitigation inspections exist for the same reason. They document the features the models count.
Building Age and Code Changes
A home built in 1975 and one built in 2015 don’t behave the same way in a storm. Models keep hundreds of variants to reflect different building eras, since construction rules changed over time. The Florida model updates its wind loads to match the Florida Building Code. In 2020 the code adopted the ASCE 7-16 wind provisions, and researchers studied how that changes modeled damage.
So an older home with weak roof connections and unprotected openings usually scores as more vulnerable. That’s not a judgment call. It’s what the engineering and claims data show.
Storm Surge and Flood Need Their Own Models
Wind is only part of the story. Water from storm surge and heavy rain damages homes differently, and many policies cover flood separately. The Florida public model started with wind and rain. The state later funded work to add storm surge and freshwater flooding, and to keep wind losses and water losses apart.
In November 2024, just after Helene and Milton, the state commission accepted three flood models. One came from Karen Clark and Company, one from Aon’s Impact Forecasting, and one was a public model built by university teams with NOAA. Those storms produced more flood claims than some insurers expected.
Where Machine Learning Helps
Physics-based surge models are accurate but slow. Researchers now train deep learning models to copy their results much faster. A 2025 study from Pacific Northwest National Laboratory used one called DeepSurge to estimate surge from 900,000 synthetic hurricanes. It found much higher risk for Florida.
Private firms use machine learning too. A Guidewire HazardHub report from July 2026 says underwriters can now judge catastrophe exposure one structure at a time instead of relying on broad regional averages.
The Human Side of the Code
There’s some programming psychology in all of this. People write the models, and people choose the assumptions. How well does an old roof connection hold? How often is a shutter installed correctly? Those answers come from judgment, and different teams judge differently. Good teams know this and test their assumptions against real claims data.
Why Two Models Give Two Different Numbers
Experts have said Florida’s approved models can differ by as much as 50 percent on loss projections. That gap used to matter a lot, because insurers had to pick from a short list. A 2023 state law now lets insurers use an average of two or more approved models when they file for rate increases. As of late 2024, the commission accepts wind models from at least six vendors, including Karen Clark, Impact Forecasting, and FIU.
How Accurate Are They
Better than most people assume, but not perfect. After Hurricane Wilma in 2005, the state’s public model estimated $7.05 billion in insured losses. Actual losses came in around $6.9 billion, a gap of about 2 percent. For Irma in 2017, FIU researchers estimated $19.4 billion in wind losses to Florida residents, and said the figure would change as more wind data came in.
Unusual storms are harder to model. Fast intensification, odd tracks, and heavy rain in places that don’t normally flood all stretch the assumptions.
What the 2026 Numbers Show
A Guidewire HazardHub analysis released in July found more than 3.4 million Florida homes at elevated combined risk from wind and storm surge. That’s about 35 percent of the state’s housing. NOAA’s early outlook for 2026 pointed to a near-average or slightly below-average season. But the report’s point was clear: a quiet season doesn’t lower the risk for any one home.
Nationally, a 2025 Cotality report counted 33.1 million homes at moderate or greater risk of hurricane wind damage, with a combined rebuild cost of $11.7 trillion.
What Homeowners Can Do With This
You can’t change the model. You can change what it sees. Here’s where to start:
- Get a wind mitigation inspection to document your roof, openings, and connections
- Ask your insurer which features lower your premium
- Compare quotes from at least two carriers, since they may use different models
- Put money into the roof and openings first, since those are the parts the models focus on
- Check flood coverage on its own, because wind policies don’t cover it
- Keep photos and receipts for every upgrade
Showing Risk Clearly Online
Insurers and companies that sell protection products also have to explain all this to customers. A good web design Fort Lauderdale team can build quote tools and risk pages that put the numbers in plain language, so a homeowner doesn’t have to read an actuarial report to understand a result.
Final Thoughts
Hurricane damage models aren’t crystal balls. They’re structured estimates built from storm simulations, engineering tests, and claims data. They work best for comparing choices, not for promising exact outcomes. If you know how they work, you can ask insurers better questions and spend upgrade money where it counts. And since the models keep improving, expect the numbers to keep changing.