
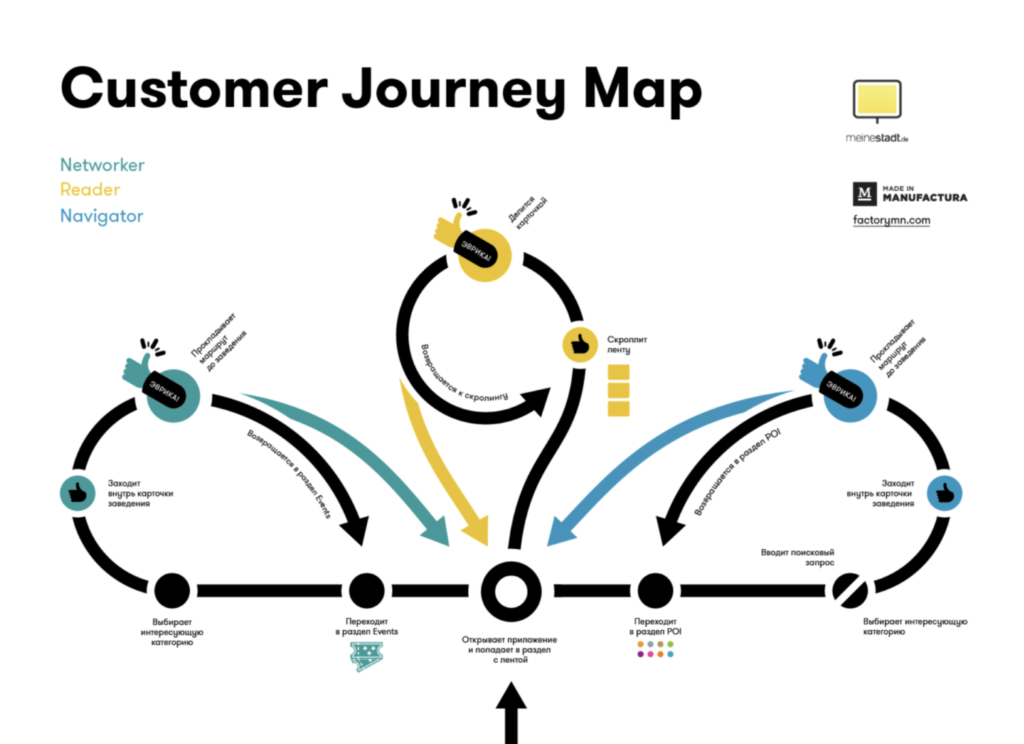
Understanding how customers move from their first interaction with a brand to completing a purchase is essential for sustainable business growth. Every website visit, product view, signup, and checkout action provides information about customer behavior. However, collecting data alone is not enough. Businesses need to understand what that data reveals about customer needs, obstacles, and decision-making.
Conversion funnel analysis helps companies identify where potential customers lose interest, which marketing channels attract valuable visitors, and what improvements can encourage more people to take action. When businesses analyze conversion funnels, they can uncover opportunities to improve the customer journey, increase conversions, and make better use of their marketing budgets.
1. Understand the Stages of a Conversion Funnel
A conversion funnel represents the steps a person takes before completing a desired action, such as purchasing a product, subscribing to a newsletter, or requesting a consultation. It is called a funnel because the number of people progressing through each stage generally decreases as they move toward conversion.
A typical ecommerce funnel includes awareness, product discovery, adding an item to the cart, beginning checkout, and completing a purchase. A business selling professional services might instead track website visits, service-page views, contact-form submissions, qualified leads, and booked consultations.
The first step in effective analysis is defining these stages clearly. Each stage should represent a meaningful customer action that can be measured consistently.
Businesses should also distinguish between micro-conversions and the final conversion. For example, downloading a guide may indicate interest, while completing a purchase represents a more direct business outcome. Tracking both can reveal how customers progress toward their goals.
2. Establish Clear Conversion Metrics
Once the funnel stages are defined, choose the metrics that will help measure performance. The right metrics depend on the business model and the purpose of the funnel.
Common metrics include:
- Conversion rate: The percentage of eligible visitors who complete a specific action.
- Drop-off rate: The percentage of users who leave a stage without progressing to the next one.
- Click-through rate: The percentage of users who click a particular link or call to action.
- Cost per acquisition: The average marketing cost associated with acquiring a customer.
- Time to conversion: The time users take to complete a desired action.
For example, if 1,000 visitors reach a product page and 100 add an item to their carts, the product-page-to-cart conversion rate is 10%.
Calculating these metrics consistently makes it easier to compare funnel performance across campaigns, devices, customer segments, and time periods.
It is also important to define denominators correctly. A conversion rate based on unique users may differ from one based on sessions or individual events. Using consistent definitions prevents misleading comparisons.
3. Identify Where Customers Drop Off
One of the main purposes of funnel analysis is finding the stages where potential customers stop progressing.
Imagine an ecommerce website receives 10,000 visitors. Of those visitors, 2,000 view a product, 800 add an item to their cart, 400 begin checkout, and 280 complete a purchase.
These figures produce the following stage-to-stage conversion rates:
| Funnel transition | Conversion rate |
| Visitors to product views | 20% |
| Product views to cart additions | 40% |
| Cart additions to checkout | 50% |
| Checkout to purchase | 70% |
The largest numerical drop-off occurs between the initial visitors and product views. However, this does not automatically mean that the first stage is the most important problem. Some visitors may arrive for research rather than purchasing, and not all traffic sources have the same intent.
The next step is investigating why users leave. Potential explanations include irrelevant advertising, unclear product information, unexpected shipping charges, complicated forms, slow page loading, or a lack of trust.
Funnel data identifies where to investigate; additional evidence is needed to establish the cause.
4. Segment Data to Understand Different Customer Journeys
A single funnel can conceal important differences between customer groups. Visitors arriving through paid search may behave differently from those coming through organic search, email campaigns, or social media.
Similarly, new visitors may need more information before purchasing, while returning customers may already understand the product and move through the funnel more quickly.
Segmenting funnel data can help businesses identify these differences. Useful segments may include:
- Marketing channel and campaign.
- Mobile, desktop, and tablet users.
- New versus returning customers.
- Geographic region, where appropriate.
- Product category or customer type.
- First-time versus repeat purchasers.
For example, if mobile users abandon checkout more frequently than desktop users, the business could investigate mobile form usability, payment options, or page performance.
Segmentation should be approached carefully. Small sample sizes can produce unstable conversion rates, and differences between groups do not necessarily establish causation. Comparing similar periods and audiences can make the findings more meaningful.
5. Use Analytics Tools to Collect Reliable Data
Accurate funnel analysis depends on reliable tracking. If important events are missing, duplicated, or incorrectly configured, the resulting insights may be misleading.
Analytics platforms can help businesses record customer actions and visualize movement through different stages. Tools such as Google Analytics 4, product analytics platforms, and customer relationship management systems can provide information about website behavior, lead progression, and completed transactions.
Before analyzing results, verify that each funnel event fires correctly. Check that purchases are recorded once, important form submissions are tracked, and internal testing traffic is handled appropriately.
Businesses should also document how each event is defined. For example, a checkout event might represent the beginning of checkout rather than the submission of payment information. Clear definitions make reports easier to interpret and maintain.
Privacy should remain part of the process. Collect only the information needed for legitimate analytical purposes, respect applicable consent requirements, and avoid placing sensitive personal information in analytics events.
6. Combine Quantitative Data With Customer Feedback
Conversion metrics show what users do, but they rarely explain every reason behind their decisions. To understand customer motivation, businesses should combine funnel reports with qualitative research.
Useful methods include customer interviews, usability testing, feedback surveys, support-ticket analysis, and reviews. Session recordings or heatmaps may also help identify usability issues when implemented with appropriate privacy safeguards.
Suppose a funnel shows that many customers abandon their carts. Analytics can quantify the problem, while customer feedback may reveal that delivery dates are unclear or shipping fees appear too late in the process.
These insights help teams distinguish between possible explanations and prioritize changes that address actual customer concerns.
Avoid assuming that one customer’s experience represents the entire audience. Look for recurring patterns and compare qualitative findings with broader behavioral data before making major decisions.
7. Test Improvements Through Controlled Experiments
After identifying a potential problem, businesses should test changes rather than relying entirely on assumptions.
A/B testing allows teams to compare two versions of a page or experience. For example, a company might test a shorter checkout form against its existing form to determine whether reducing the number of fields improves purchase completion.
Other experiments could examine different calls to action, clearer pricing information, simplified navigation, or alternative product-page layouts.
Before launching a test, establish a clear hypothesis, select a primary success metric, and determine how results will be evaluated. Whenever possible, run experiments with appropriately randomized groups and enough observations to detect a meaningful effect.
Avoid declaring a winner simply because one version performs better during the first few hours. Results can fluctuate, especially when traffic is limited or customer behavior varies by day.
A successful test should demonstrate a meaningful improvement without creating unacceptable trade-offs in revenue, customer quality, refunds, or other important outcomes.
8. Prioritize Changes by Business Impact
Businesses often discover more funnel problems than they can address at once. Prioritization helps teams focus on improvements that offer the greatest potential value.
Consider three factors when evaluating an opportunity: the likely impact on conversions, the confidence in the supporting evidence, and the effort required to implement the change.
A minor improvement to a high-traffic checkout page may create more value than a major redesign of a page visited by very few people. Likewise, fixing a broken form may be more urgent than changing a headline that already performs reasonably well.
Teams should document each issue, the evidence supporting it, the proposed solution, and the metric that will determine success.
After implementation, continue monitoring the funnel to verify whether the improvement lasts. Customer expectations, traffic sources, product offerings, and market conditions change over time, so funnel analysis should be an ongoing process rather than a one-time project.
Conclusion
Conversion funnel analysis helps businesses understand how customers move through their digital experiences and where obstacles prevent them from completing important actions. By defining funnel stages, measuring conversion rates, investigating drop-offs, segmenting audiences, and combining analytics with customer feedback, companies can develop a clearer picture of the customer journey.
The most effective approach goes beyond identifying low-performing stages. It focuses on discovering why customers struggle, testing practical improvements, and measuring whether those changes produce meaningful results.
When businesses consistently analyze conversion funnels, they can make more informed marketing decisions, improve website usability, and create smoother experiences that support customer satisfaction and long-term growth. The goal is not simply to push more visitors toward a final action, but to remove unnecessary friction and help customers achieve what they came to do.