
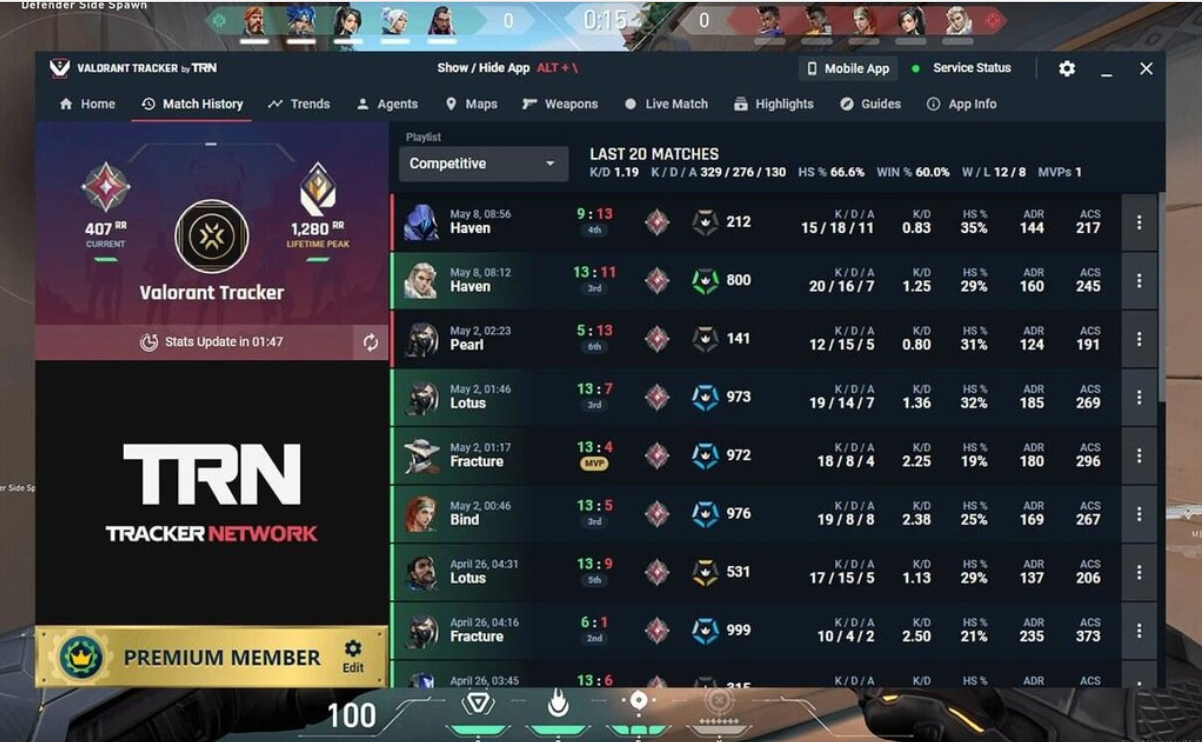

A single competitive VALORANT match produces more structured data than many analysts touch in a normal workday. Every round logs damage dealt, trade timings, ability usage, and economy calls for all ten players. Most of us close the client and requeue without reading a single number in it.
That habit is the gap between hardstuck and climbing. The players who move up are rarely the ones with the fastest crosshair. They are the ones who treat their match history as a dataset and act on it. A good VALORANT stat tracker does the reading for you, turning raw match data into something legible.
Your Last Ranked Match Was a Dataset

VALORANT records almost everything you do: kills, deaths, assists, headshot percentage, first-blood rate, economy rating, and the catch-all Average Combat Score. If you have never played, think of ACS as a blended KPI that weights damage, multikills, and utility assists into one figure rather than counting raw frags.
Here is the trap any data person will recognize. One metric never tells the whole story. ACS quietly underrates Controllers and Sentinels, whose smokes and traps win rounds without padding the scoreboard. A tracker that gives you a single number is a dashboard with a single tile. The useful ones break performance down by map, agent, and side, so a rough 42% win rate on Split reads as a post-plant problem rather than an aim problem. That matters more since Patch 13.00 opened Act 4 with the map Summit and a round of Sentinel and Initiator buffs, leaving last season’s memory stale.
The Best VALORANT Trackers at a Glance

|
Tracker |
Best for |
Platform |
Signature feature |
|---|---|---|---|
|
Tracker.gg |
Deep match history and profiles |
Web plus Windows overlay (Overwolf) |
Per-agent, per-map, per-side win rate breakdowns |
|
Blitz.gg |
Real-time in-game overlays |
Windows desktop app |
Live combat overlay and agent-select scouting |
|
VLR.gg |
Pro and esports data |
Web |
VCT match stats analysts actually cite |
|
Riot official API |
Building custom tools |
Developer access via Riot Sign On |
Raw match history behind an OAuth key |
Tracker.gg

Tracker.gg, the flagship from Tracker Network, is the incumbent and the biggest public source of VALORANT stats anywhere. The web profile is free and covers rank lookup, K/D, match history, and per-agent breakdowns, plus global and regional leaderboards for benchmarking against your region. Open any match, and you get the full scoreboard, roster, and a round-by-round timeline.
The desktop overlay ships via Overwolf, a Riot-approved platform that installs with a single download and overlays real-time analytics on the game without triggering the anti-cheat. You can opt out of data collection and skip the sign-in, a plus for privacy. The deepest breakdowns and MMR graphs sit behind a premium tier, but the free layer answers most questions.
Blitz.gg

Where Tracker.gg is a data warehouse you visit, Blitz.gg is an overlay that rides along with every game. Its combat overlay updates Combat Score, headshot percentage, and kills in real time, using data Riot has publicly cleared as safe, though some players still debate how much a live overlay should show. The loading-screen and agent-select overlays scout enemy ranks pre-round, and the lineup tool maps ability spots for every agent and map.
What separates Blitz is the jump from measuring to fixing. It benchmarks you against players in your rank and flags the weaknesses dragging your numbers down. When the overlay circles the same problem for weeks, and solo grinding stops moving the needle, some players bring in structured coaching or a rank boost to break the plateau and see how a higher-elo player reads the same rounds. The data shows what is wrong. Sometimes you still need a human to explain why.
Tracker.gg and Blitz.gg are not the only names in this space. Two other established trackers, dak.gg and op.gg (valorant.op.gg), cover the same ground: rank lookup, match history, and per-agent stats pulled from the same public match data. Plenty of players bounce between one of these and Tracker.gg out of habit as much as necessity, since the underlying numbers converge either way.
Read Your VALORANT Stats Like a Data Scientist

A tracker is only as honest as the sample you feed it. Five games is noise. Fifty games is signal. Before you rebuild your agent pool because Jett felt bad last night, check that you have the sample size to justify it. Variance in a single session is brutal, and one bad run proves nothing.
The clean way to test a change is to isolate one variable at a time. Learning a new Controller? Judge it on its own win rate across a real sample, not on the one game you first-timed it. Some players keep a separate account for this, treating a second ranked-ready account as a testbed so a new agent’s learning curve never pollutes their main’s win-rate data. Serious analysts go further, modeling win rates from public match data in open Kaggle datasets. Log the change, wait for the matches, then read the result. That is A/B testing with your rank on the line.
Where the Pros’ Data Lives: VLR.gg and Riot’s API

If your own match history stops being enough, the professional scene is an open book. VLR.gg aggregates every VCT match into player and agent stats, kills per round, K/D, combat score, and clutch rates, usually updated within minutes of a series ending. Analysts and researchers lean on it constantly, which is why so much public VALORANT modeling starts there.
For anyone who would rather build than browse, Riot exposes match history through its official developer API. It is gated: personal keys do not work, and you need a production key plus an OAuth opt-in through Riot Sign On before pulling player data. Strict, but that gate is why the trackers you trust stay accurate and above board.