
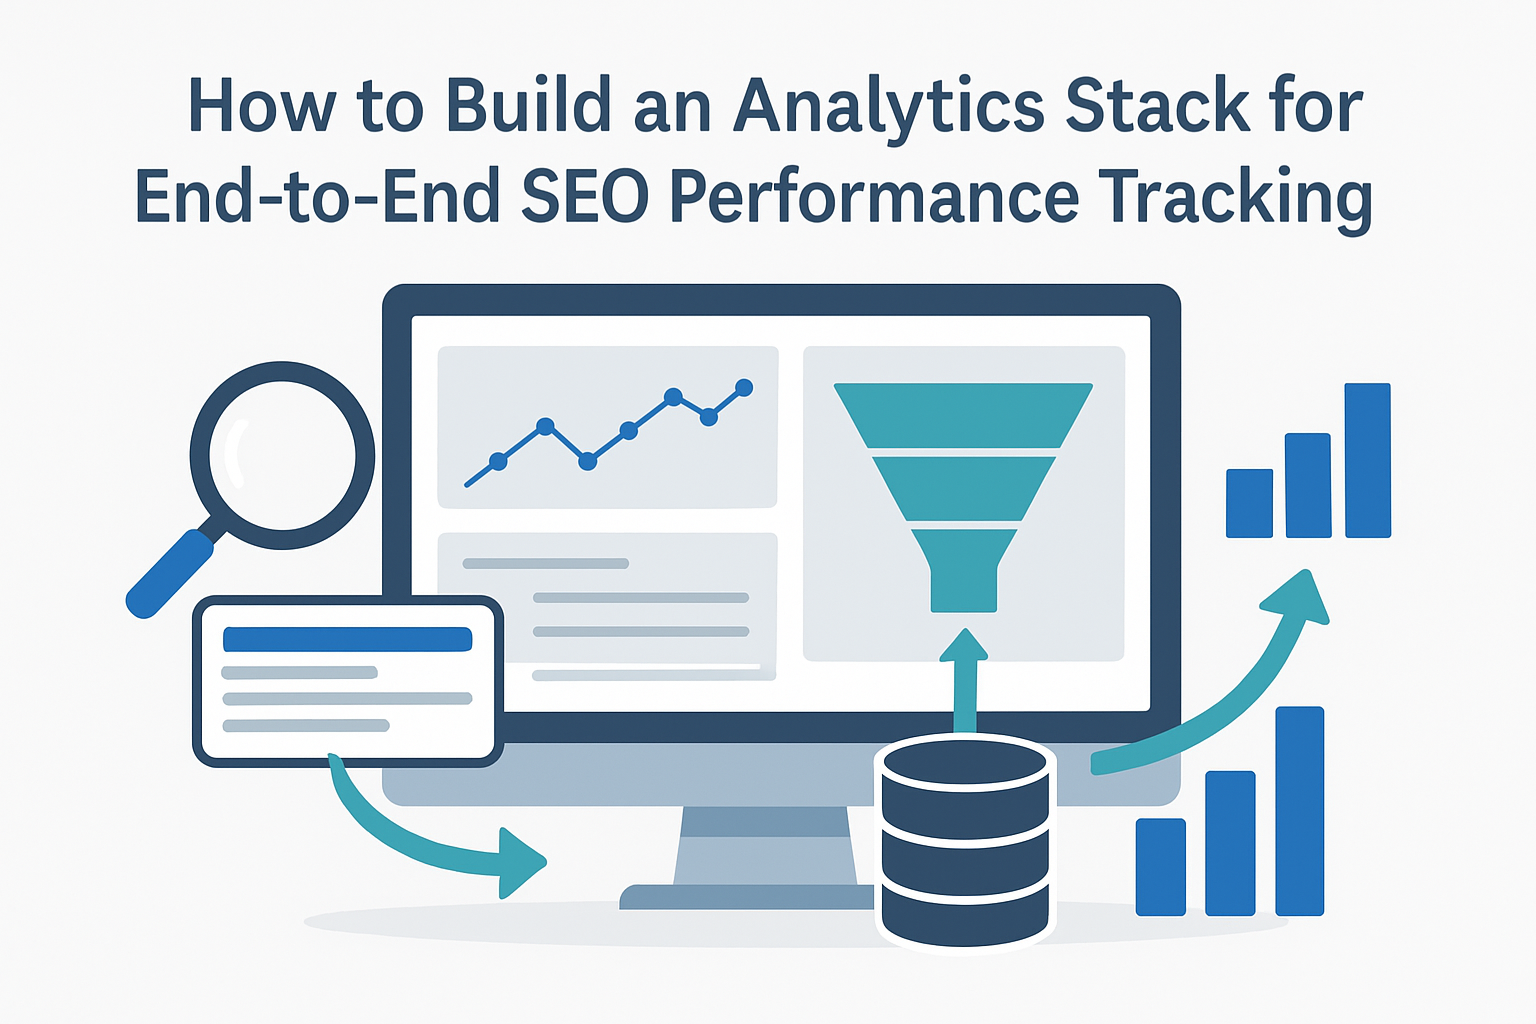
Most sites still live and die by search. Recent analyses suggest that about 53% of all website traffic comes from organic search, making it the largest single acquisition channel. At the same time, Ahrefs’ research shows that around 96.55% of pages get zero organic traffic from Google, which means most content never gets seen
An SEO analytics stack should exist to push you into the small slice that does get traffic and prove that this traffic drives revenue. For a data-science audience, that means treating SEO as a proper data pipeline: from crawl and query data to business outcomes, modeled in a warehouse and exposed via clear metrics.
Below is a dense, end-to-end blueprint.
1. What “End-to-End SEO Tracking” Really Means
End-to-end tracking means you can follow a clean chain for any URL / content cluster / experiment:
- Discovery & crawling – can search bots reach the page?
- Indexation & visibility – impressions, queries, positions.
- On-site behavior – sessions, events, engagement rate.
- Conversions & revenue – leads, sales, MRR, upgrades.
- Customer value – retention, LTV, payback period for organic users.
If you can’t answer questions like “Which cluster generated the most pipeline last quarter?” or “Which experiment changed organic revenue?”, your stack is incomplete.
2. Core Data Sources: What You Actually Need
Think in layers of ground truth.
2.1 Search-Side Truth: Google Search Console (GSC)
GSC gives query–page pairs and basic performance:
- Queries, pages, impressions, clicks, CTR, average position.
- Dimensions: device, country, search type, search appearance.
It answers “what people searched” and “how often we appeared and got clicked.” Use the Search Console API or BigQuery export to pull data at a daily cadence.
2.2 On-Site Truth: Google Analytics 4 (GA4)
GA4 holds the interaction layer:
- Sessions, engaged sessions, engagement rate.
- Event-based tracking: scrolls, button clicks, form submits.
- Conversions and revenue (e-commerce or custom events).
- Channel / source / medium including Organic Search.
Key design choice: define clean “SEO sessions” (e.g., default channel = Organic Search, plus filters for brand vs non-brand where needed) so you can isolate organic performance in downstream models.
2.3 Technical & Crawl Truth: Logs + Crawlers
For serious SEO analysis, logs and crawls are essential:
- Server logs: show which URLs Googlebot/Bingbot visit, status codes, crawl frequency, and wasted crawl on non-valuable URLs.
- Crawl data (Screaming Frog, Sitebulb, or custom scrapers): expose internal linking, depth, canonicalization, hreflang, indexability flags, and content characteristics.
This combination lets you measure crawl efficiency, indexation gaps, and the impact of structural fixes (e.g., pruning thin pages, improving internal links).
2.4 Ranking & SERP Data
You still need rank/SERP data, even in an AI-search era:
- Daily/weekly rankings for target keywords and clusters.
- SERP features: snippets, sitelinks, image packs, AI overviews (where tracked).
- Pixel-based position or relative SERP visibility.
This data is useful for change-point analysis: you can correlate major ranking shifts with releases, migrations, or algorithm updates.
2.5 Business & Product Data
Without business data, SEO is a vanity metric. Bring in:
- CRM / sales: lead status, deal size, close date, source.
- Billing / subscriptions: MRR, churn, plan upgrades/downgrades.
- Product analytics: activation, feature usage, retention.
For data science work, this is where you can model LTV by acquisition channel, organic payback windows, or cluster-level ROI.
3. Storage: From “Exports” to a Real Warehouse
Spreadsheets are fine for prototypes, but they collapse fast once you track more than a few hundred URLs.
3.1 Lightweight Option: Sheets + Connectors
- Export GSC and GA4 data regularly or use connectors.
- Join on landing page + date manually or via simple scripts.
- Tag pages by topic, funnel stage, or content type.
Good for very small sites or one-off studies. Bad for long-term, multi-market SEO where you need deep historical data and granular queries.
3.2 Serious Option: BigQuery (or Any Cloud Warehouse)
BigQuery is a common choice because GA4 and GSC integrate directly with it.
Standard pattern:
- Export GA4 event data into events_* tables.
- Export GSC performance data into search tables (searchdata_site, searchdata_url).
- Load logs and crawl outputs as separate tables.
- Replicate CRM/billing data via ETL tools or custom jobs.
Other warehouses (Snowflake, Redshift, Postgres) work too, but GA4→BigQuery is almost zero-friction and well documented.
4. Modeling: Turn Raw Data into SEO-Ready Tables
Raw tables are messy. Modeling is where you make SEO analysis easy and repeatable.
4.1 Unify Dimensions
Create shared dimensions:
- dim_page: canonical URL, page ID, template type (blog, docs, landing, etc.), topic cluster, funnel stage.
- dim_date: calendar fields, week, month, quarter.
- dim_query: raw query, brand/non-brand flag, intent label (informational / commercial / transactional), language.
Brand detection can start with a simple regex around your brand and product names; you can later replace it with a small classification model.
4.2 Build Aggregated Fact Tables
Typical high-value tables:
- fact_seo_page_day
- Key: page ID + date.
- Metrics: impressions, clicks, CTR, avg position (from GSC), sessions, engaged sessions, conversions, revenue (from GA4), crawl depth, indexability, bot hits (from logs).
- fact_seo_query_page_day
- Key: query ID + page ID + date.
- Metrics: impressions, clicks, CTR, avg position, country, device.
These tables make it trivial to answer questions like:
- “How did non-brand clicks evolve for our pricing pages month-over-month?”
- “Which pages have high impressions but weak CTR in key markets?”
- “Which cluster has high engagement but low conversion, suggesting content misalignment?”
4.3 Link to Business Metrics
Join SEO fact tables with:
- fact_revenue (orders, subscription events) keyed on user/session IDs or landing pages where direct attribution is possible.
- fact_pipeline (opportunities, stages, amounts).
The result: cluster-level revenue and pipeline per visit, not just session counts.
5. Dashboards and Alerting: Making the Data Usable
Even the cleanest warehouse fails if stakeholders can’t read it. You need opinionated dashboards and alerting.
5.1 Tools: Looker Studio + BI Layer
Google’s own guidance shows how using Search Console and Google Analytics together in Looker Studio gives a more complete view of how people find and use your site. There are many public templates that already blend GA4 and GSC data for SEO.
Typical setup:
- Looker Studio or SE-specific templates for marketing and SEO teams.
- Metabase/Tableau/Power BI for deeper data-science exploration and ad-hoc queries.
5.2 Core Dashboards (Keep Them Few and Sharp)
- SEO Business Overview
- Organic sessions, leads, revenue, and LTV over time.
- Top clusters and pages by revenue and conversions.
- High-level channel mix vs other channels.
- SEO Visibility & Health
- Impressions, clicks, CTR, average position by country/device/cluster.
- Indexation coverage (indexed vs non-indexed, key template types).
- Crawl stats and error distributions.
- Content & Cluster Performance
- Performance by topic cluster and funnel stage.
- New vs existing content trends.
- Engagement metrics vs conversion for each cluster.
- Experiment Board
- List of SEO tests, test windows, target URLs/queries.
- Uplift in clicks, sessions, conversions, and revenue.
- Confidence intervals or Bayesian posterior if you run more advanced models.
5.3 Alerts and Anomaly Detection
Use scheduled queries or lightweight scripts to monitor:
- Sudden drops in impressions, clicks, or conversions for key markets/clusters.
- Sharp changes in CTR for important queries (e.g., new SERP feature or competitor).
- Crawl anomalies (spikes in 4xx/5xx for URLs that matter).
Alerts can go to Slack/Teams/email. The goal is to detect and investigate issues before they appear as monthly traffic disasters.
6. Metrics That Actually Matter
Given the rise of AI overviews and zero-click results, pure ranking reports are losing explanatory power. But search still dominates traffic: some studies show the average website receives about 53% of its traffic from organic search, far more than from social media.
Your stack should expose three metric layers:
- Visibility metrics – impressions, clicks, CTR, average position, SERP features.
- Engagement metrics – sessions, engaged sessions, scroll depth, micro-conversions.
- Business metrics – leads, signups, revenue, MRR, LTV, payback period.
For prioritisation and forecasting, the business layer matters most: you want to compare clusters based on incremental revenue, not just traffic.
7. Example Architecture
A practical reference architecture might look like this:
- Ingestion
- GSC and GA4 streaming/exports to BigQuery.
- Nightly ingestion of logs via cloud storage → BigQuery.
- Scheduled exports of crawl data.
- CRM/billing replicated via ETL.
- Warehouse
- BigQuery with raw, staging, and analytics schemas.
- dbt or SQL scripts to transform raw tables into dimensions and fact tables.
- Analytics Layer
- Looker Studio dashboards for marketing and SEO.
- BI tool and notebooks for deeper modeling and custom studies.
- Automation
- Cron or Cloud Scheduler for daily refresh and anomaly checks.
- Notification hooks to Slack/email when thresholds are exceeded.
If your internal team doesn’t have the bandwidth or experience to design and maintain such a stack, you can work with an SEO agency such as Rank Visely to help connect search data, product data, and revenue into a coherent measurement system that decision-makers can trust.
8. Implementation Roadmap
To actually ship this and avoid “perpetual planning mode,” keep it iterative:
- Define concrete questions (e.g., “Which content cluster drives the most revenue?”, “Where did last quarter’s organic dip come from?”).
- Audit what’s already available (GA4 setup quality, GSC properties, log access, CRM structure).
- Set up a minimal warehouse: GSC + GA4 + one month of logs is enough to start modeling.
- Create a single fact_seo_page_day table and one high-impact dashboard tied to revenue.
- Expand gradually: add query-level tables, cluster labels, experiment tracking, then anomaly alerts.
Once this is in place, SEO stops being a collection of isolated tools and slides. It becomes a measurable, testable, and optimizable growth engine that data scientists and SEOs can both work on with the same dataset and the same language.
Final Words
A good SEO analytics stack isn’t about shiny tools—it’s about a clean line from search query to revenue. When GSC, GA4, crawl/log data, and business metrics all feed into a central warehouse and shared models, you stop guessing which pages matter and start knowing which clusters, markets, and experiments drive real outcomes.
Start simple: define key questions, centralize data, build one reliable “page × day” table, and ship a revenue-focused dashboard. Then layer on clusters, tests, and alerts. Done right, your stack turns SEO from reporting overhead into a predictable, testable growth engine.