
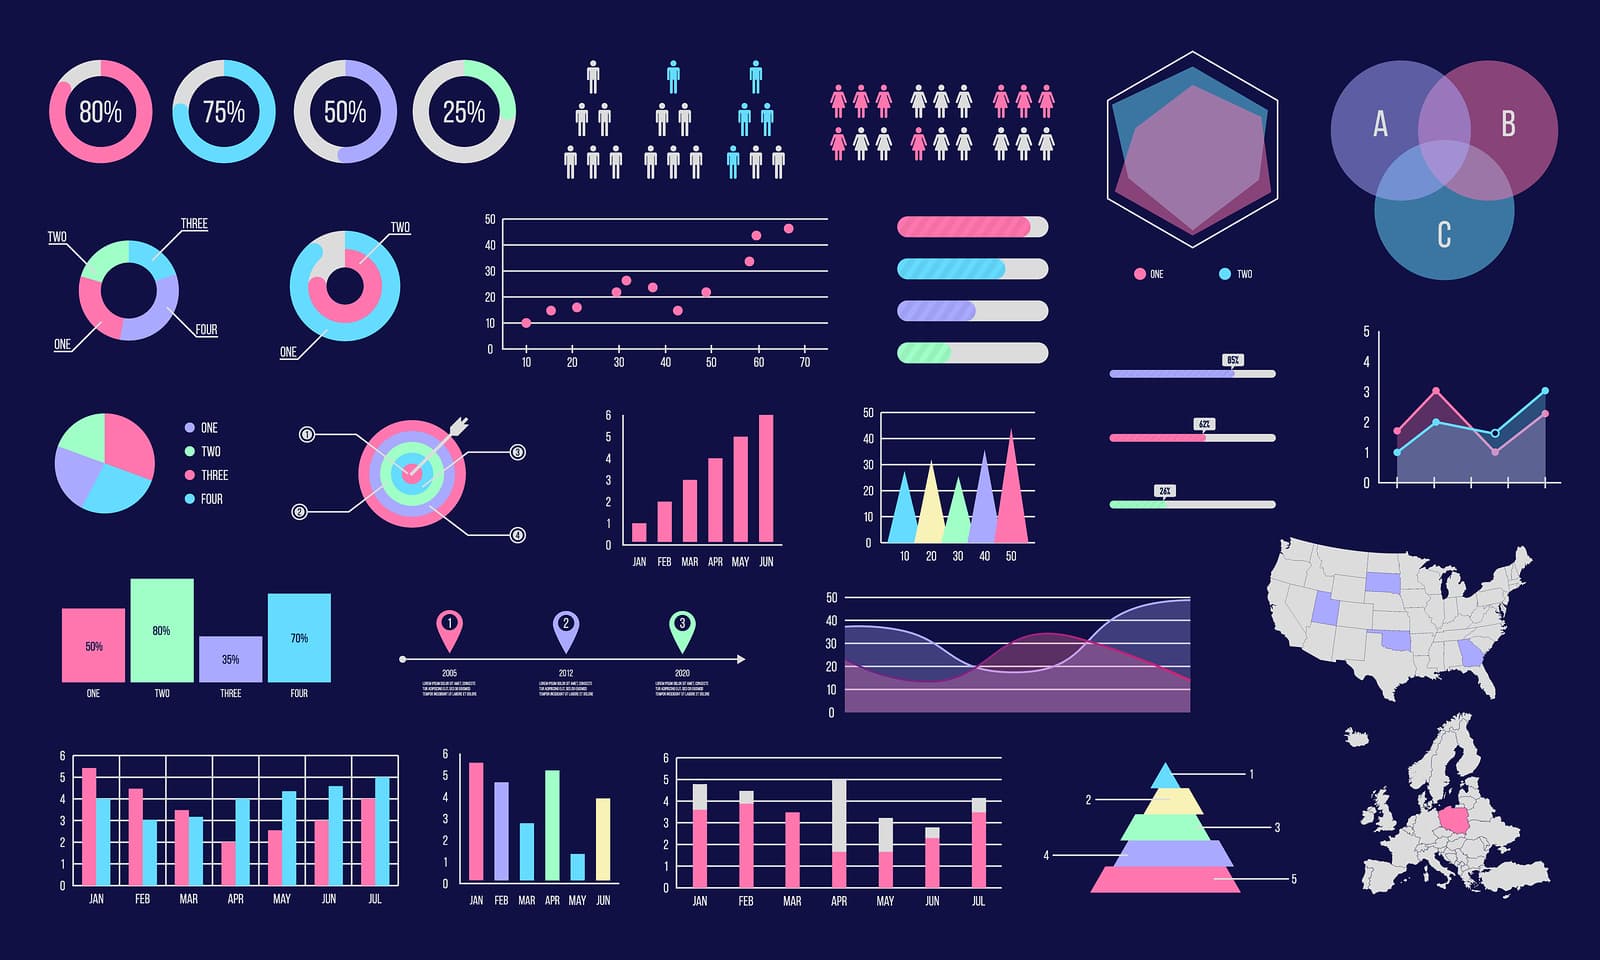
We’re surrounded by data all the time, whether we notice it or not, but if we’re being honest, most of it just doesn’t hit home unless we can present it in a way that makes people pay attention. And that’s exactly what data visualization for storytelling does—it takes complex information and turns it into something memorable. It turns out, people retain 65% of visual information just three days after viewing it, compared to only 10% of written info. When we visualize data, it comes down to helping people remember what matters, and that’s why it’s so important to focus on the right visuals and structure the whole thing in a way that tells a compelling story.
Why Knowing Your Story is the First Step
Know your story. Sounds simple enough, right? But here’s why this seemingly simple step is so crucial: when you have a clear sense of what your main message is and what you want your audience to take away, you can actually create visuals that match that purpose. This is where a lot of people go wrong—overcomplicating things or adding unnecessary details that only confuse the audience. You don’t want to lose people in a maze of charts and graphs, so clarity is key here. Start by figuring out what’s most important and build around that. If the key message is “we’ve saved x amount by going green,” make sure your visuals reinforce that, and avoid the temptation to throw in random stats just because they seem cool. You need to stay focused.
The Chart
Just because a chart looks cool or flashy doesn’t necessarily mean it’s the right choice for your data. Here’s what is important to remember: each set of data has its own story to tell, and choosing the wrong type of visualization can confuse your audience and in the worst case, mislead them entirely. Put it another way, some data points are clearly better suited for a pie chart, while others will convey their message more effectively with a line graph or bar chart. When the wrong chart is used, it can complicate things unnecessarily, and if people can’t easily interpret the information, what’s the point of even presenting it? In fact, studies show that 90% of the information transmitted to the brain is visual, which makes it so clear how important it is to pick the right visuals to connect with your audience.
Less is More
Once your visuals are set, it’s time to highlight the key takeaways. With attention spans getting shorter and shorter, you need to make sure your main points really pop. Focus on what truly matters and ditch the unnecessary details. Here’s where AI consulting comes in as a major advantage because AI tools can sift through mountains of data to pinpoint what’s most important, and can save you time and effort in deciding which insights are worth focusing on. This helps you avoid overwhelming your audience with every detail, and instead allow you to zero in on the points that really hit home. In the U.S. and certain parts of Europe, AI consulting has been on the rise, and the results are undeniable. For example, in Tallinn AI consulting is gaining momentum as more businesses realize how valuable it is for optimizing data and driving smarter decisions. In other words, with AI, you can be sure you’re highlighting the insights that’ll make the biggest impact without getting bogged down in the noise.
Keep It Moving
Every visualization should naturally lead to the next, and guide your audience from point A to point B without making them feel lost. There needs to be a beginning, middle, and end. If your visuals are jumping all over the place or don’t connect logically, you’re going to lose your audience. This is where a solid structure is indispensable: start with the context, present the data, and finish with a clear takeaway.
Context is Everything
Without context, data is just…numbers. You need to give your audience enough background to understand what’s going on. That means explaining where the data comes from, what it represents, and why it matters. Don’t assume that your audience will automatically understand the context just because you do. If they don’t know the “why” behind the numbers, they’ll lose interest fast.
At the end of the day, the goal is pretty straightforward: what you really want is for your audience to fully understand your message, not just in the moment, but also to retain it so that it sticks with them long after they’ve seen it. And, you don’t just want them to remember it—you want them to actually take some kind of action with that information. Whether it’s making a decision, changing their perspective, or acting on what they’ve learned, the real win is when they do something because of what you’ve shared. If you can get your audience to walk away with a clear takeaway, hold onto that message, and then use it in a meaningful way, that’s when you know you’ve truly nailed it. It comes down to making a lasting impact, not just delivering information.