
Introduction
Data has become a critical resource for organizations in every industry. However, the true value of data lies in its ability to be transformed into actionable insights that drive business outcomes. Power BI dashboards offer a robust solution for turning raw data into interactive, real-time visualizations that inform decision-making and optimize performance. In this article, we will examine the key advantages of Power BI dashboards and how they enable businesses to unlock the full potential of their data.
1. Comprehensive Data Visualization
1.1. Interactive and Dynamic Visuals
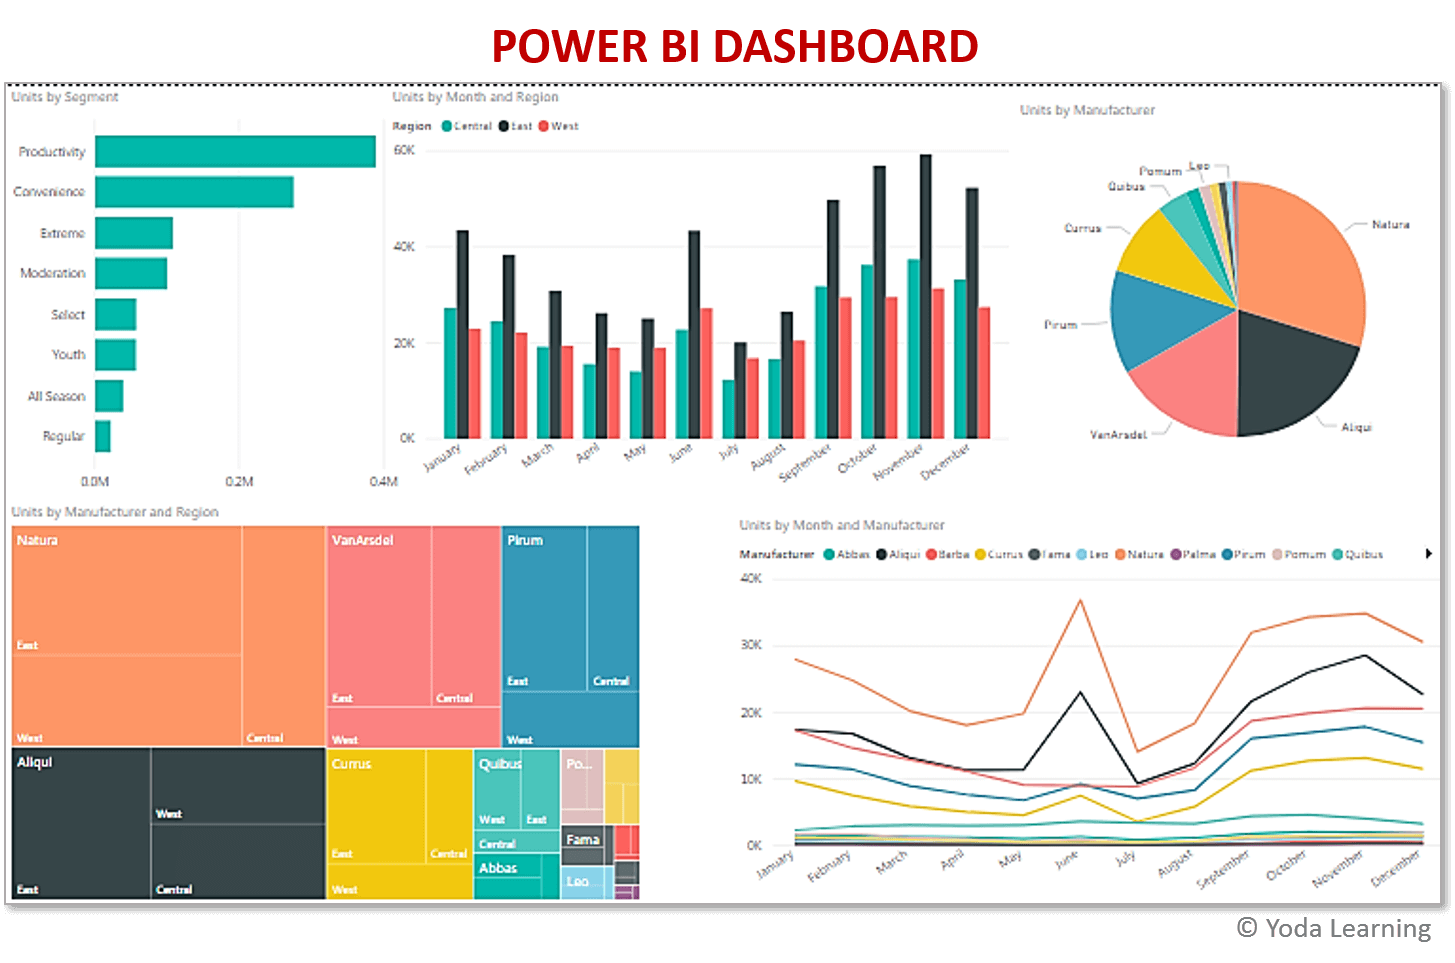
Power BI dashboards allow users to create interactive and dynamic visualizations that go beyond static charts or graphs. Users can interact with the data by clicking on individual elements to drill down into more granular details. This level of interactivity enables businesses to explore their data in greater depth and uncover insights that might otherwise remain hidden.
1.2. Custom Visualizations
In addition to the wide variety of standard visualizations available, Power BI also allows users to import custom visuals from the Microsoft AppSource marketplace. This customization offers businesses the flexibility to present their data in a way that best fits their needs and objectives. Whether it’s advanced heat maps, funnel charts, or geographic maps, businesses can tailor their dashboards to showcase the most relevant data.
2. Integration with AI and Machine Learning
2.1. AI-Powered Insights
Power BI dashboards are equipped with AI-powered tools that automatically analyze data and generate insights. The Quick Insights feature, for example, can scan large datasets and highlight patterns, trends, or anomalies that users may have overlooked. This capability accelerates the analysis process and helps businesses make informed decisions faster.
2.2. Predictive Analytics
For businesses that want to go beyond historical analysis, Power BI dashboards support predictive analytics. By leveraging machine learning models, Power BI can forecast future trends based on historical data, allowing businesses to anticipate changes in the market, customer behavior, or operational performance. Predictive analytics helps businesses make proactive decisions that position them for success in the future.
3. Streamlined Data Sharing and Collaboration
3.1. Easy Sharing with Stakeholders
Power BI dashboards make it easy to share insights across teams, departments, or even external partners. Users can share reports and dashboards with just a few clicks, ensuring that everyone in the organization has access to the same up-to-date information. This level of transparency fosters better collaboration and ensures that all stakeholders are working from a single source of truth.
3.2. Cloud-Based Collaboration
As a cloud-based platform, Power BI facilitates collaboration across geographically dispersed teams. With cloud access, team members can log in from anywhere and view or update dashboards in real time. This functionality is particularly valuable for remote or global teams, as it ensures that all members have equal access to critical business data regardless of location.
4. Enhanced Data Security
4.1. Comprehensive Security Features
Power BI dashboards come with a wide range of security features that ensure data is protected at all times. Users can assign role-based permissions to control who has access to specific reports or datasets. Power BI also includes features like data encryption, multi-factor authentication, and audit logs, providing businesses with the peace of mind that their data is secure.
4.2. Compliance with Industry Regulations
For businesses operating in industries with strict compliance requirements, such as healthcare or finance, Power BI dashboards offer a solution that meets various regulatory standards. Power BI complies with global data privacy regulations, including GDPR, HIPAA, and SOC, making it a trusted tool for organizations that handle sensitive data.
5. Seamless Integration with Existing Systems
5.1. Integrating Data from Multiple Sources
One of the standout features of Power BI dashboards is their ability to integrate data from multiple sources. Whether it’s an internal CRM system, cloud storage, social media platforms, or other external databases, Power BI consolidates this data into one comprehensive dashboard. This seamless integration eliminates the need for manual data entry or complex coding and ensures that businesses have a unified view of all their data.
5.2. Integration with Microsoft Tools
For organizations already using Microsoft products, Power BI dashboards integrate seamlessly with tools like Excel, SharePoint, Azure, and Microsoft Teams. This compatibility makes it easier to incorporate Power BI into existing workflows and processes. For example, teams can pull data directly from Excel spreadsheets into Power BI or use Teams to collaborate on reports and dashboards in real time.
6. Improved Decision-Making and Business Outcomes
6.1. Data-Driven Decisions
The ability to visualize and analyze data in real-time empowers businesses to make more informed decisions. Power BI dashboards provide a comprehensive overview of key metrics, performance indicators, and trends, enabling decision-makers to base their strategies on accurate and up-to-date information. This data-driven approach leads to better outcomes, as businesses can adjust their operations based on actionable insights.
6.2. Faster Time to Insight
With Power BI dashboards, the time it takes to generate insights from raw data is significantly reduced. The platform’s automated data processing and visualization features mean that businesses no longer have to spend hours or days manually analyzing data. This faster time to insight enables companies to react more quickly to changing market conditions or operational challenges.
7. Scalability and Flexibility for Growing Businesses
7.1. Adapting to Changing Needs
As businesses grow, their data needs evolve. Power BI dashboards are designed to scale alongside the organization, making it easy to add new data sources, users, or reports as needed. This scalability ensures that businesses don’t outgrow the platform and can continue to rely on Power BI for their analytics needs as they expand.
7.2. Flexible Usage Across Industries
Power BI’s flexibility makes it suitable for businesses in virtually any industry. Whether it’s retail, healthcare, finance, or manufacturing, Power BI dashboards can be tailored to meet the specific needs of each sector. The platform’s versatility allows organizations to adapt dashboards to track KPIs that are most relevant to their industry, ensuring that they get the insights they need to succeed.
Conclusion
Power BI dashboards offer numerous advantages for businesses looking to harness the power of their data. From advanced visualizations and AI-powered insights to seamless collaboration and enhanced security, Power BI empowers organizations to make data-driven decisions that drive success. With its scalability, flexibility, and cost-effectiveness, Power BI is an invaluable tool for any business aiming to unlock the full potential of its data