
The modern world is that of data; communication of information therefore becomes key. Enter data visualization—everything from numbers and statistics that turn into gorgeous charts, graphs, and infographics, speaking to audiences across boards. This comprehensive guide will walk you through the fine art of data visualization, equipping you with skills for turning plain data into clear, compelling narratives.
The Power of Visual Storytelling: Why Data Visualization Matters
Imagine describing a complex trend by going through pages of numbers. Not very exciting, right? It is in this gap that Data Visualization fills. By presenting your data in a more visually appealing and digestible format, it will let you:
Communicate Insights: sable data sets become clear stories about which audiences can understand key trends and relationships. Data visualization is a means of breaking down complex information into small pieces that will really stick with the viewer, regardless of their technical background.
Engage Your Audience: Attention-grabbing visuals promote better retention. Data visualization makes use of the human brain’s predisposition to process visual information more efficiently than plain text reports. Charts, graphs, and infographics can incite interest and keep the audience interested in the data that is being presented.
- Visual Advantage: Our brains are wired for visuals! According to Visme’s research by 3M, a whopping 90% of the information transmitted to the brain is visual. This emphasizes the effectiveness of data visualization for knowledge transfer and information retention.
- Retention Advantage: People retain 65% of the information three days after viewing an image with data compared to only 10% from hearing information. This highlights the power of visuals for knowledge retention.
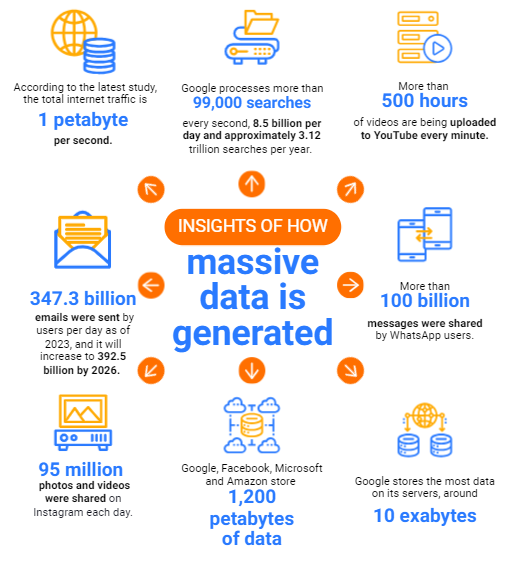
Drive Actionable Decisions: Data visualization is all about empowering decision-making based on the discovery of trends and outcomes. It allows for finding trends, outliers, and correlations in data that would otherwise remain hidden within a raw data set. Accordingly, this empowers one to support decisions by data with higher confidence levels.
Data visualization is such a powerful tool that it can handle with equal ease data scientists, marketers, educators, entrepreneurs, or policymakers, really any person who wants to communicate information effectively.
In your journey to visualize data, many techniques will be learned to represent your data.
Market Trends:
- Market Expansion: According to Linearity.io The global data visualization market is projected to reach a staggering USD 10.2 billion by 2025, up from $7.6 billion in 2021. This signifies significant market growth and increasing adoption.
- Interactive Revolution: Interactive data visualization tools are anticipated to see a 30% increase in adoption by 2024. This highlights the growing interest in dynamic and user-driven visualizations that allow for deeper exploration of data.
Beyond Bar Charts: A Compendium of Visualization Techniques
There’s a lot more to data visualization than the humble bar chart. Here’s a glance at a few well-known techniques, each suited for specific data types and purposes:
Bar Charts: The applications include the comparison of categories or changes across time when the data are discrete. Bar charts are very useful to make comparisons among different groups or categories in a data set. They are straightforward and thus can be quite useful in highlighting differences between quantities or values.
Line Charts: Suitable for showing trends and other ongoing changes over time. Line graphs are very good for the graphical representation of the trend or patterns over time. This is achieved by plotting a series of points and then connecting those points with a line to easily conceptualize how some variable changes over a particular time range.
Pie Charts: These charts are very useful for showing proportions of a whole but really can only highlight a few categories. The utility of pie charts lies in representing data that adds up to a whole, such as the breakdown of a budget or distribution of market share. However, they lose effectiveness when there is a large number of categories, because the pie chart becomes cluttered and difficult to read.
Scatter Plots: Represent the relationship between two variables, showing correlation or patterns. Scatter plots portray the relationship between two numerical variables. Mapping each data point along horizontal and vertical axes, you should be able to see some potential correlation or pattern between the two variables.
Heatmaps: A representation of data through color variation over a grid. Most appropriate for large data sets that are two-dimensional. Heatmaps are perfect for visualization of huge data containing two dimensions. Color in this case is used to reflect the data values, thereby showing the pattern and trends underlying the values, that might be very hard to identify within a table or spreadsheet
Infographics: It’s all put together with visualization elements, text, and illustrations to depict a complete data story. They are an amazing way to present an extensive data story in this very lucid and visually engaging format. They can use charts, graphs, illustrations, and text to create a compelling narrative that educates and informs viewers.
The choice of chart type will be based on the information to be conveyed and the audience. Good data visualization requires much more than these basic chart selections, citing design principles specific to clarity and impact.
To Understand Data Visualization & Concepts Related to Data Science. Enroll in our Data Science Course in Bengaluru & Become the Future’s Best Data Scientist.